Dow Jones Industrial Average Outlook
Dow Jones Industrial Average Forecast Values.
DJIA Index Values, Average of Month.
| Month | Date | Forecast Value | Avg Error |
|---|---|---|---|
| 0 | Mar 2024 | 39096.39 | ±0.00 |
| 1 | Apr 2024 | 38843 | ±296 |
| 2 | May 2024 | 38572 | ±347 |
| 3 | Jun 2024 | 37726 | ±376 |
| 4 | Jul 2024 | 36770 | ±397 |
| 5 | Aug 2024 | 35410 | ±413 |
| 6 | Sep 2024 | 34480 | ±427 |
| 7 | Oct 2024 | 34750 | ±438 |
| 8 | Nov 2024 | 35000 | ±448 |
Get the Rest of the Story with the 5 Year Forecast!
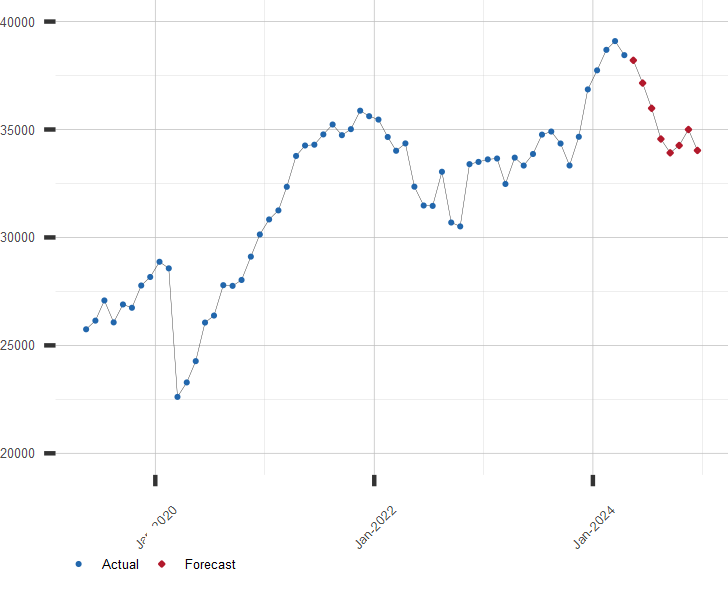
DJIA Chart
Chart of the DJIA with Current Projection.
Other Stock Market Links of Interest:
A long range forecast for the DJIA and similar financial series are available by subscription
Click here for more information or to subscribe now| April 23, 2024 | ||
| Stock Market | Value | Change |
|---|---|---|
| U.S. S&P 500 | 5,070.55 | 1.20% |
| Japan Nikkei 225 | 37,552.16 | 0.30% |
| Hong Kong Hang Seng | 16,828.93 | 1.92% |
| UK FTSE 100 | 8,044.81 | 0.26% |
| German DAX | 18,137.65 | 1.55% |
| Brazil Bovespa | 125,148.07 | -0.34% |