The Financial Forecast Center™
Long Range Forecasts
| Home | Data | Accuracy | About Us | Contact Us | Search |
| Stock Market Forecasts | Interest Rate Forecasts | Exchange Rate Forecasts | Economics & Price Forecasts |
U.S. Consumer Price Index Extended Forecast
-- SAMPLE ONLY --
Chart of Consumer Price Index with Extended Forecast
Index of consumer prices, 1982-1984=100, not seasonally adjusted
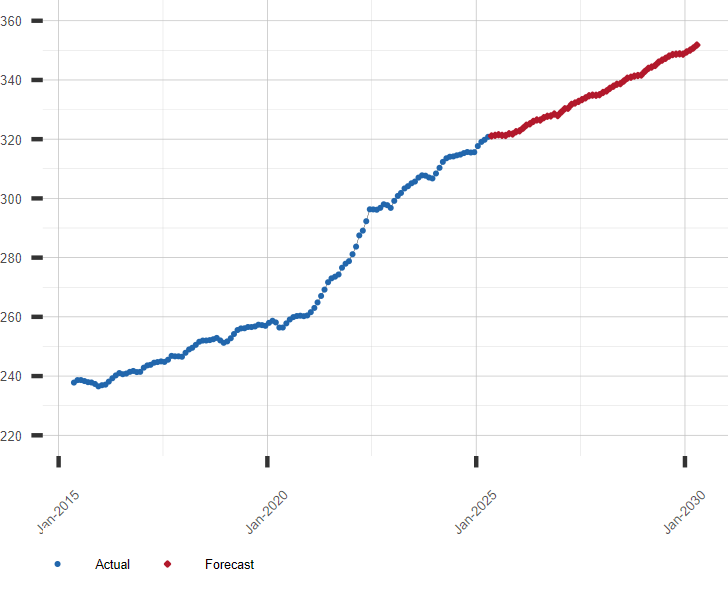
Subscribe Via PayPal For Only $38.95
U.S. Consumer Price Index Forecast Values
Price Index. 1982-1984=100, Not Seasonally Adjusted.
| Month |
Date |
Forecast Value |
Avg Error |
| 0 |
Jun 2026 |
333.952 |
±0.000 |
| 1 |
Jul 2026 |
334.24 |
±0.21 |
| 2 |
Aug 2026 |
333.95 |
±0.29 |
| 3 |
Sep 2026 |
334.10 |
±0.34 |
| 4 |
Oct 2026 |
333.43 |
±0.38 |
| 5 |
Nov 2026 |
332.97 |
±0.40 |
| 6 |
Dec 2026 |
332.70 |
±0.43 |
| 7 |
Jan 2027 |
333.62 |
±0.44 |
| 8 |
Feb 2027 |
334.20 |
±0.46 |
| 9 |
Mar 2027 |
335.43 |
±0.47 |
| 10 |
Apr 2027 |
336.90 |
±0.49 |
| 11 |
May 2027 |
338.20 |
±0.50 |
| 12 |
Jun 2027 |
339.29 |
±0.51 |
| 13 |
Jul 2027 |
340.13 |
±0.52 |
| 14 |
Aug 2027 |
340.89 |
±0.53 |
| 15 |
Sep 2027 |
341.30 |
±0.53 |
| 16 |
Oct 2027 |
341.27 |
±0.54 |
| 17 |
Nov 2027 |
341.02 |
±0.55 |
| 18 |
Dec 2027 |
340.91 |
±0.56 |
| 19 |
Jan 2028 |
341.89 |
±0.56 |
| 20 |
Feb 2028 |
342.87 |
±0.57 |
| 21 |
Mar 2028 |
344.09 |
±0.58 |
| 22 |
Apr 2028 |
344.95 |
±0.58 |
| 23 |
May 2028 |
346.01 |
±0.59 |
| 24 |
Jun 2028 |
346.66 |
±0.59 |
| 25 |
Jul 2028 |
347.89 |
±0.60 |
| 26 |
Aug 2028 |
348.42 |
±0.60 |
| 27 |
Sep 2028 |
348.39 |
±0.61 |
| 28 |
Oct 2028 |
348.22 |
±0.61 |
| 29 |
Nov 2028 |
347.97 |
±0.61 |
| 30 |
Dec 2028 |
347.98 |
±0.62 |
| 31 |
Jan 2029 |
348.61 |
±0.62 |
| 32 |
Feb 2029 |
349.14 |
±0.63 |
| 33 |
Mar 2029 |
349.94 |
±0.63 |
| 34 |
Apr 2029 |
351.07 |
±0.63 |
| 35 |
May 2029 |
351.45 |
±0.64 |
| 36 |
Jun 2029 |
352.06 |
±0.64 |
| 37 |
Jul 2029 |
352.97 |
±0.64 |
| 38 |
Aug 2029 |
353.69 |
±0.65 |
| 39 |
Sep 2029 |
353.89 |
±0.65 |
| 40 |
Oct 2029 |
354.07 |
±0.65 |
| 41 |
Nov 2029 |
354.01 |
±0.66 |
| 42 |
Dec 2029 |
353.85 |
±0.66 |
| 43 |
Jan 2030 |
354.87 |
±0.66 |
| 44 |
Feb 2030 |
355.87 |
±0.66 |
| 45 |
Mar 2030 |
356.63 |
±0.67 |
| 46 |
Apr 2030 |
358.25 |
±0.67 |
| 47 |
May 2030 |
358.87 |
±0.67 |
| 48 |
Jun 2030 |
359.43 |
±0.67 |
| 49 |
Jul 2030 |
360.20 |
±0.68 |
| 50 |
Aug 2030 |
360.17 |
±0.68 |
| 51 |
Sep 2030 |
360.19 |
±0.68 |
| 52 |
Oct 2030 |
360.18 |
±0.68 |
| 53 |
Nov 2030 |
360.51 |
±0.69 |
| 54 |
Dec 2030 |
360.40 |
±0.69 |
| 55 |
Jan 2031 |
361.03 |
±0.69 |
| 56 |
Feb 2031 |
361.59 |
±0.69 |
| 57 |
Mar 2031 |
362.86 |
±0.70 |
| 58 |
Apr 2031 |
363.80 |
±0.70 |
| 59 |
May 2031 |
364.56 |
±0.70 |
| 60 |
Jun 2031 |
365.21 |
±0.70 |
Download Historical Data
U.S. Consumer Price Index Historical Trend Chart
Includes Extended Forecast
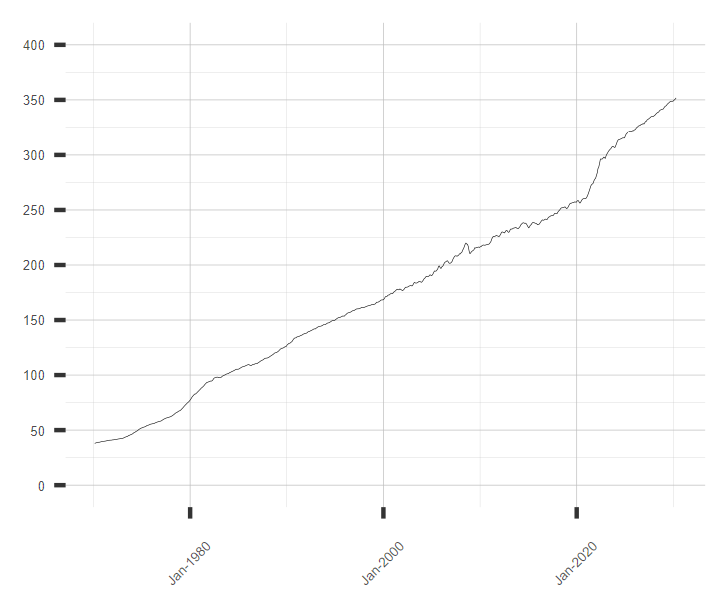
Subscribe Via PayPal For Only $38.95
Other Consumer Price and Inflation Links of Interest:
U.S. Consumer Price Index Historical Values
Price Index. 1982-1984=100, Not Seasonally Adjusted.
| Date |
Historical Value |
| Jan 1970 |
37.800 |
| Feb 1970 |
38.000 |
| Mar 1970 |
38.200 |
| Apr 1970 |
38.500 |
| May 1970 |
38.600 |
| Jun 1970 |
38.800 |
| Jul 1970 |
39.000 |
| Aug 1970 |
39.000 |
| Sep 1970 |
39.200 |
| Oct 1970 |
39.400 |
| Nov 1970 |
39.600 |
| Dec 1970 |
39.800 |
| Jan 1971 |
39.800 |
| Feb 1971 |
39.900 |
| Mar 1971 |
40.000 |
| Apr 1971 |
40.100 |
| May 1971 |
40.300 |
| Jun 1971 |
40.600 |
| Jul 1971 |
40.700 |
| Aug 1971 |
40.800 |
| Sep 1971 |
40.800 |
| Oct 1971 |
40.900 |
| Nov 1971 |
40.900 |
| Dec 1971 |
41.100 |
| Jan 1972 |
41.100 |
| Feb 1972 |
41.300 |
| Mar 1972 |
41.400 |
| Apr 1972 |
41.500 |
| May 1972 |
41.600 |
| Jun 1972 |
41.700 |
| Jul 1972 |
41.900 |
| Aug 1972 |
42.000 |
| Sep 1972 |
42.100 |
| Oct 1972 |
42.300 |
| Nov 1972 |
42.400 |
| Dec 1972 |
42.500 |
| Jan 1973 |
42.600 |
| Feb 1973 |
42.900 |
| Mar 1973 |
43.300 |
| Apr 1973 |
43.600 |
| May 1973 |
43.900 |
| Jun 1973 |
44.200 |
| Jul 1973 |
44.300 |
| Aug 1973 |
45.100 |
| Sep 1973 |
45.200 |
| Oct 1973 |
45.600 |
| Nov 1973 |
45.900 |
| Dec 1973 |
46.200 |
| Jan 1974 |
46.600 |
| Feb 1974 |
47.200 |
| Mar 1974 |
47.800 |
| Apr 1974 |
48.000 |
| May 1974 |
48.600 |
| Jun 1974 |
49.000 |
| Jul 1974 |
49.400 |
| Aug 1974 |
50.000 |
| Sep 1974 |
50.600 |
| Oct 1974 |
51.100 |
| Nov 1974 |
51.500 |
| Dec 1974 |
51.900 |
| Jan 1975 |
52.100 |
| Feb 1975 |
52.500 |
| Mar 1975 |
52.700 |
| Apr 1975 |
52.900 |
| May 1975 |
53.200 |
| Jun 1975 |
53.600 |
| Jul 1975 |
54.200 |
| Aug 1975 |
54.300 |
| Sep 1975 |
54.600 |
| Oct 1975 |
54.900 |
| Nov 1975 |
55.300 |
| Dec 1975 |
55.500 |
| Jan 1976 |
55.600 |
| Feb 1976 |
55.800 |
| Mar 1976 |
55.900 |
| Apr 1976 |
56.100 |
| May 1976 |
56.500 |
| Jun 1976 |
56.800 |
| Jul 1976 |
57.100 |
| Aug 1976 |
57.400 |
| Sep 1976 |
57.600 |
| Oct 1976 |
57.900 |
| Nov 1976 |
58.000 |
| Dec 1976 |
58.200 |
| Jan 1977 |
58.500 |
| Feb 1977 |
59.100 |
| Mar 1977 |
59.500 |
| Apr 1977 |
60.000 |
| May 1977 |
60.300 |
| Jun 1977 |
60.700 |
| Jul 1977 |
61.000 |
| Aug 1977 |
61.200 |
| Sep 1977 |
61.400 |
| Oct 1977 |
61.600 |
| Nov 1977 |
61.900 |
| Dec 1977 |
62.100 |
| Jan 1978 |
62.500 |
| Feb 1978 |
62.900 |
| Mar 1978 |
63.400 |
| Apr 1978 |
63.900 |
| May 1978 |
64.500 |
| Jun 1978 |
65.200 |
| Jul 1978 |
65.700 |
| Aug 1978 |
66.000 |
| Sep 1978 |
66.500 |
| Oct 1978 |
67.100 |
| Nov 1978 |
67.400 |
| Dec 1978 |
67.700 |
| Jan 1979 |
68.300 |
| Feb 1979 |
69.100 |
| Mar 1979 |
69.800 |
| Apr 1979 |
70.600 |
| May 1979 |
71.500 |
| Jun 1979 |
72.300 |
| Jul 1979 |
73.100 |
| Aug 1979 |
73.800 |
| Sep 1979 |
74.600 |
| Oct 1979 |
75.200 |
| Nov 1979 |
75.900 |
| Dec 1979 |
76.700 |
| Jan 1980 |
77.800 |
| Feb 1980 |
78.900 |
| Mar 1980 |
80.100 |
| Apr 1980 |
81.000 |
| May 1980 |
81.800 |
| Jun 1980 |
82.700 |
| Jul 1980 |
82.700 |
| Aug 1980 |
83.300 |
| Sep 1980 |
84.000 |
| Oct 1980 |
84.800 |
| Nov 1980 |
85.500 |
| Dec 1980 |
86.300 |
| Jan 1981 |
87.000 |
| Feb 1981 |
87.900 |
| Mar 1981 |
88.500 |
| Apr 1981 |
89.100 |
| May 1981 |
89.800 |
| Jun 1981 |
90.600 |
| Jul 1981 |
91.600 |
| Aug 1981 |
92.300 |
| Sep 1981 |
93.200 |
| Oct 1981 |
93.400 |
| Nov 1981 |
93.700 |
| Dec 1981 |
94.000 |
| Jan 1982 |
94.300 |
| Feb 1982 |
94.600 |
| Mar 1982 |
94.500 |
| Apr 1982 |
94.900 |
| May 1982 |
95.800 |
| Jun 1982 |
97.000 |
| Jul 1982 |
97.500 |
| Aug 1982 |
97.700 |
| Sep 1982 |
97.900 |
| Oct 1982 |
98.200 |
| Nov 1982 |
98.000 |
| Dec 1982 |
97.600 |
| Jan 1983 |
97.800 |
| Feb 1983 |
97.900 |
| Mar 1983 |
97.900 |
| Apr 1983 |
98.600 |
| May 1983 |
99.200 |
| Jun 1983 |
99.500 |
| Jul 1983 |
99.900 |
| Aug 1983 |
100.200 |
| Sep 1983 |
100.700 |
| Oct 1983 |
101.000 |
| Nov 1983 |
101.200 |
| Dec 1983 |
101.300 |
| Jan 1984 |
101.900 |
| Feb 1984 |
102.400 |
| Mar 1984 |
102.600 |
| Apr 1984 |
103.100 |
| May 1984 |
103.400 |
| Jun 1984 |
103.700 |
| Jul 1984 |
104.100 |
| Aug 1984 |
104.500 |
| Sep 1984 |
105.000 |
| Oct 1984 |
105.300 |
| Nov 1984 |
105.300 |
| Dec 1984 |
105.300 |
| Jan 1985 |
105.500 |
| Feb 1985 |
106.000 |
| Mar 1985 |
106.400 |
| Apr 1985 |
106.900 |
| May 1985 |
107.300 |
| Jun 1985 |
107.600 |
| Jul 1985 |
107.800 |
| Aug 1985 |
108.000 |
| Sep 1985 |
108.300 |
| Oct 1985 |
108.700 |
| Nov 1985 |
109.000 |
| Dec 1985 |
109.300 |
| Jan 1986 |
109.600 |
| Feb 1986 |
109.300 |
| Mar 1986 |
108.800 |
| Apr 1986 |
108.600 |
| May 1986 |
108.900 |
| Jun 1986 |
109.500 |
| Jul 1986 |
109.500 |
| Aug 1986 |
109.700 |
| Sep 1986 |
110.200 |
| Oct 1986 |
110.300 |
| Nov 1986 |
110.400 |
| Dec 1986 |
110.500 |
| Jan 1987 |
111.200 |
| Feb 1987 |
111.600 |
| Mar 1987 |
112.100 |
| Apr 1987 |
112.700 |
| May 1987 |
113.100 |
| Jun 1987 |
113.500 |
| Jul 1987 |
113.800 |
| Aug 1987 |
114.400 |
| Sep 1987 |
115.000 |
| Oct 1987 |
115.300 |
| Nov 1987 |
115.400 |
| Dec 1987 |
115.400 |
| Jan 1988 |
115.700 |
| Feb 1988 |
116.000 |
| Mar 1988 |
116.500 |
| Apr 1988 |
117.100 |
| May 1988 |
117.500 |
| Jun 1988 |
118.000 |
| Jul 1988 |
118.500 |
| Aug 1988 |
119.000 |
| Sep 1988 |
119.800 |
| Oct 1988 |
120.200 |
| Nov 1988 |
120.300 |
| Dec 1988 |
120.500 |
| Jan 1989 |
121.100 |
| Feb 1989 |
121.600 |
| Mar 1989 |
122.300 |
| Apr 1989 |
123.100 |
| May 1989 |
123.800 |
| Jun 1989 |
124.100 |
| Jul 1989 |
124.400 |
| Aug 1989 |
124.600 |
| Sep 1989 |
125.000 |
| Oct 1989 |
125.600 |
| Nov 1989 |
125.900 |
| Dec 1989 |
126.100 |
| Jan 1990 |
127.400 |
| Feb 1990 |
128.000 |
| Mar 1990 |
128.700 |
| Apr 1990 |
128.900 |
| May 1990 |
129.200 |
| Jun 1990 |
129.900 |
| Jul 1990 |
130.400 |
| Aug 1990 |
131.600 |
| Sep 1990 |
132.700 |
| Oct 1990 |
133.500 |
| Nov 1990 |
133.800 |
| Dec 1990 |
133.800 |
| Jan 1991 |
134.600 |
| Feb 1991 |
134.800 |
| Mar 1991 |
135.000 |
| Apr 1991 |
135.200 |
| May 1991 |
135.600 |
| Jun 1991 |
136.000 |
| Jul 1991 |
136.200 |
| Aug 1991 |
136.600 |
| Sep 1991 |
137.200 |
| Oct 1991 |
137.400 |
| Nov 1991 |
137.800 |
| Dec 1991 |
137.900 |
| Jan 1992 |
138.100 |
| Feb 1992 |
138.600 |
| Mar 1992 |
139.300 |
| Apr 1992 |
139.500 |
| May 1992 |
139.700 |
| Jun 1992 |
140.200 |
| Jul 1992 |
140.500 |
| Aug 1992 |
140.900 |
| Sep 1992 |
141.300 |
| Oct 1992 |
141.800 |
| Nov 1992 |
142.000 |
| Dec 1992 |
141.900 |
| Jan 1993 |
142.600 |
| Feb 1993 |
143.100 |
| Mar 1993 |
143.600 |
| Apr 1993 |
144.000 |
| May 1993 |
144.200 |
| Jun 1993 |
144.400 |
| Jul 1993 |
144.400 |
| Aug 1993 |
144.800 |
| Sep 1993 |
145.100 |
| Oct 1993 |
145.700 |
| Nov 1993 |
145.800 |
| Dec 1993 |
145.800 |
| Jan 1994 |
146.200 |
| Feb 1994 |
146.700 |
| Mar 1994 |
147.200 |
| Apr 1994 |
147.400 |
| May 1994 |
147.500 |
| Jun 1994 |
148.000 |
| Jul 1994 |
148.400 |
| Aug 1994 |
149.000 |
| Sep 1994 |
149.400 |
| Oct 1994 |
149.500 |
| Nov 1994 |
149.700 |
| Dec 1994 |
149.700 |
| Jan 1995 |
150.300 |
| Feb 1995 |
150.900 |
| Mar 1995 |
151.400 |
| Apr 1995 |
151.900 |
| May 1995 |
152.200 |
| Jun 1995 |
152.500 |
| Jul 1995 |
152.500 |
| Aug 1995 |
152.900 |
| Sep 1995 |
153.200 |
| Oct 1995 |
153.700 |
| Nov 1995 |
153.600 |
| Dec 1995 |
153.500 |
| Jan 1996 |
154.400 |
| Feb 1996 |
154.900 |
| Mar 1996 |
155.700 |
| Apr 1996 |
156.300 |
| May 1996 |
156.600 |
| Jun 1996 |
156.700 |
| Jul 1996 |
157.000 |
| Aug 1996 |
157.300 |
| Sep 1996 |
157.800 |
| Oct 1996 |
158.300 |
| Nov 1996 |
158.600 |
| Dec 1996 |
158.600 |
| Jan 1997 |
159.100 |
| Feb 1997 |
159.600 |
| Mar 1997 |
160.000 |
| Apr 1997 |
160.200 |
| May 1997 |
160.100 |
| Jun 1997 |
160.300 |
| Jul 1997 |
160.500 |
| Aug 1997 |
160.800 |
| Sep 1997 |
161.200 |
| Oct 1997 |
161.600 |
| Nov 1997 |
161.500 |
| Dec 1997 |
161.300 |
| Jan 1998 |
161.600 |
| Feb 1998 |
161.900 |
| Mar 1998 |
162.200 |
| Apr 1998 |
162.500 |
| May 1998 |
162.800 |
| Jun 1998 |
163.000 |
| Jul 1998 |
163.200 |
| Aug 1998 |
163.400 |
| Sep 1998 |
163.600 |
| Oct 1998 |
164.000 |
| Nov 1998 |
164.000 |
| Dec 1998 |
163.900 |
| Jan 1999 |
164.300 |
| Feb 1999 |
164.500 |
| Mar 1999 |
165.000 |
| Apr 1999 |
166.200 |
| May 1999 |
166.200 |
| Jun 1999 |
166.200 |
| Jul 1999 |
166.700 |
| Aug 1999 |
167.100 |
| Sep 1999 |
167.900 |
| Oct 1999 |
168.200 |
| Nov 1999 |
168.300 |
| Dec 1999 |
168.300 |
| Jan 2000 |
168.800 |
| Feb 2000 |
169.800 |
| Mar 2000 |
171.200 |
| Apr 2000 |
171.300 |
| May 2000 |
171.500 |
| Jun 2000 |
172.400 |
| Jul 2000 |
172.800 |
| Aug 2000 |
172.800 |
| Sep 2000 |
173.700 |
| Oct 2000 |
174.000 |
| Nov 2000 |
174.100 |
| Dec 2000 |
174.000 |
| Jan 2001 |
175.100 |
| Feb 2001 |
175.800 |
| Mar 2001 |
176.200 |
| Apr 2001 |
176.900 |
| May 2001 |
177.700 |
| Jun 2001 |
178.000 |
| Jul 2001 |
177.500 |
| Aug 2001 |
177.500 |
| Sep 2001 |
178.300 |
| Oct 2001 |
177.700 |
| Nov 2001 |
177.400 |
| Dec 2001 |
176.700 |
| Jan 2002 |
177.100 |
| Feb 2002 |
177.800 |
| Mar 2002 |
178.800 |
| Apr 2002 |
179.800 |
| May 2002 |
179.800 |
| Jun 2002 |
179.900 |
| Jul 2002 |
180.100 |
| Aug 2002 |
180.700 |
| Sep 2002 |
181.000 |
| Oct 2002 |
181.300 |
| Nov 2002 |
181.300 |
| Dec 2002 |
180.900 |
| Jan 2003 |
181.700 |
| Feb 2003 |
183.100 |
| Mar 2003 |
184.200 |
| Apr 2003 |
183.800 |
| May 2003 |
183.500 |
| Jun 2003 |
183.700 |
| Jul 2003 |
183.900 |
| Aug 2003 |
184.600 |
| Sep 2003 |
185.200 |
| Oct 2003 |
185.000 |
| Nov 2003 |
184.500 |
| Dec 2003 |
184.300 |
| Jan 2004 |
185.200 |
| Feb 2004 |
186.200 |
| Mar 2004 |
187.400 |
| Apr 2004 |
188.000 |
| May 2004 |
189.100 |
| Jun 2004 |
189.700 |
| Jul 2004 |
189.400 |
| Aug 2004 |
189.500 |
| Sep 2004 |
189.900 |
| Oct 2004 |
190.900 |
| Nov 2004 |
191.000 |
| Dec 2004 |
190.300 |
| Jan 2005 |
190.700 |
| Feb 2005 |
191.800 |
| Mar 2005 |
193.300 |
| Apr 2005 |
194.600 |
| May 2005 |
194.400 |
| Jun 2005 |
194.500 |
| Jul 2005 |
195.400 |
| Aug 2005 |
196.400 |
| Sep 2005 |
198.800 |
| Oct 2005 |
199.200 |
| Nov 2005 |
197.600 |
| Dec 2005 |
196.800 |
| Jan 2006 |
198.300 |
| Feb 2006 |
198.700 |
| Mar 2006 |
199.800 |
| Apr 2006 |
201.500 |
| May 2006 |
202.500 |
| Jun 2006 |
202.900 |
| Jul 2006 |
203.500 |
| Aug 2006 |
203.900 |
| Sep 2006 |
202.900 |
| Oct 2006 |
201.800 |
| Nov 2006 |
201.500 |
| Dec 2006 |
201.800 |
| Jan 2007 |
202.416 |
| Feb 2007 |
203.499 |
| Mar 2007 |
205.352 |
| Apr 2007 |
206.686 |
| May 2007 |
207.949 |
| Jun 2007 |
208.352 |
| Jul 2007 |
208.299 |
| Aug 2007 |
207.917 |
| Sep 2007 |
208.490 |
| Oct 2007 |
208.936 |
| Nov 2007 |
210.177 |
| Dec 2007 |
210.036 |
| Jan 2008 |
211.080 |
| Feb 2008 |
211.693 |
| Mar 2008 |
213.528 |
| Apr 2008 |
214.823 |
| May 2008 |
216.632 |
| Jun 2008 |
218.815 |
| Jul 2008 |
219.964 |
| Aug 2008 |
219.086 |
| Sep 2008 |
218.783 |
| Oct 2008 |
216.573 |
| Nov 2008 |
212.425 |
| Dec 2008 |
210.228 |
| Jan 2009 |
211.143 |
| Feb 2009 |
212.193 |
| Mar 2009 |
212.709 |
| Apr 2009 |
213.240 |
| May 2009 |
213.856 |
| Jun 2009 |
215.693 |
| Jul 2009 |
215.351 |
| Aug 2009 |
215.834 |
| Sep 2009 |
215.969 |
| Oct 2009 |
216.177 |
| Nov 2009 |
216.330 |
| Dec 2009 |
215.949 |
| Jan 2010 |
216.687 |
| Feb 2010 |
216.741 |
| Mar 2010 |
217.631 |
| Apr 2010 |
218.009 |
| May 2010 |
218.178 |
| Jun 2010 |
217.965 |
| Jul 2010 |
218.011 |
| Aug 2010 |
218.312 |
| Sep 2010 |
218.439 |
| Oct 2010 |
218.711 |
| Nov 2010 |
218.803 |
| Dec 2010 |
219.179 |
| Jan 2011 |
220.223 |
| Feb 2011 |
221.309 |
| Mar 2011 |
223.467 |
| Apr 2011 |
224.906 |
| May 2011 |
225.964 |
| Jun 2011 |
225.722 |
| Jul 2011 |
225.922 |
| Aug 2011 |
226.545 |
| Sep 2011 |
226.889 |
| Oct 2011 |
226.421 |
| Nov 2011 |
226.230 |
| Dec 2011 |
225.672 |
| Jan 2012 |
226.665 |
| Feb 2012 |
227.663 |
| Mar 2012 |
229.392 |
| Apr 2012 |
230.085 |
| May 2012 |
229.815 |
| Jun 2012 |
229.478 |
| Jul 2012 |
229.104 |
| Aug 2012 |
230.379 |
| Sep 2012 |
231.407 |
| Oct 2012 |
231.317 |
| Nov 2012 |
230.221 |
| Dec 2012 |
229.601 |
| Jan 2013 |
230.280 |
| Feb 2013 |
232.166 |
| Mar 2013 |
232.773 |
| Apr 2013 |
232.531 |
| May 2013 |
232.945 |
| Jun 2013 |
233.504 |
| Jul 2013 |
233.596 |
| Aug 2013 |
233.877 |
| Sep 2013 |
234.149 |
| Oct 2013 |
233.546 |
| Nov 2013 |
233.069 |
| Dec 2013 |
233.049 |
| Jan 2014 |
233.916 |
| Feb 2014 |
234.781 |
| Mar 2014 |
236.293 |
| Apr 2014 |
237.072 |
| May 2014 |
237.900 |
| Jun 2014 |
238.343 |
| Jul 2014 |
238.250 |
| Aug 2014 |
237.852 |
| Sep 2014 |
238.031 |
| Oct 2014 |
237.433 |
| Nov 2014 |
236.151 |
| Dec 2014 |
234.812 |
| Jan 2015 |
233.707 |
| Feb 2015 |
234.722 |
| Mar 2015 |
236.119 |
| Apr 2015 |
236.599 |
| May 2015 |
237.805 |
| Jun 2015 |
238.638 |
| Jul 2015 |
238.654 |
| Aug 2015 |
238.316 |
| Sep 2015 |
237.945 |
| Oct 2015 |
237.838 |
| Nov 2015 |
237.336 |
| Dec 2015 |
236.525 |
| Jan 2016 |
236.916 |
| Feb 2016 |
237.111 |
| Mar 2016 |
238.132 |
| Apr 2016 |
239.261 |
| May 2016 |
240.229 |
| Jun 2016 |
241.018 |
| Jul 2016 |
240.628 |
| Aug 2016 |
240.849 |
| Sep 2016 |
241.428 |
| Oct 2016 |
241.729 |
| Nov 2016 |
241.353 |
| Dec 2016 |
241.432 |
| Jan 2017 |
242.839 |
| Feb 2017 |
243.603 |
| Mar 2017 |
243.801 |
| Apr 2017 |
244.524 |
| May 2017 |
244.733 |
| Jun 2017 |
244.955 |
| Jul 2017 |
244.786 |
| Aug 2017 |
245.519 |
| Sep 2017 |
246.819 |
| Oct 2017 |
246.663 |
| Nov 2017 |
246.669 |
| Dec 2017 |
246.524 |
| Jan 2018 |
247.867 |
| Feb 2018 |
248.991 |
| Mar 2018 |
249.554 |
| Apr 2018 |
250.546 |
| May 2018 |
251.588 |
| Jun 2018 |
251.989 |
| Jul 2018 |
252.006 |
| Aug 2018 |
252.146 |
| Sep 2018 |
252.439 |
| Oct 2018 |
252.885 |
| Nov 2018 |
252.038 |
| Dec 2018 |
251.233 |
| Jan 2019 |
251.712 |
| Feb 2019 |
252.776 |
| Mar 2019 |
254.202 |
| Apr 2019 |
255.548 |
| May 2019 |
256.092 |
| Jun 2019 |
256.143 |
| Jul 2019 |
256.571 |
| Aug 2019 |
256.558 |
| Sep 2019 |
256.759 |
| Oct 2019 |
257.346 |
| Nov 2019 |
257.208 |
| Dec 2019 |
256.974 |
| Jan 2020 |
257.971 |
| Feb 2020 |
258.678 |
| Mar 2020 |
258.115 |
| Apr 2020 |
256.389 |
| May 2020 |
256.394 |
| Jun 2020 |
257.797 |
| Jul 2020 |
259.101 |
| Aug 2020 |
259.918 |
| Sep 2020 |
260.280 |
| Oct 2020 |
260.388 |
| Nov 2020 |
260.229 |
| Dec 2020 |
260.474 |
| Jan 2021 |
261.582 |
| Feb 2021 |
263.014 |
| Mar 2021 |
264.877 |
| Apr 2021 |
267.054 |
| May 2021 |
269.195 |
| Jun 2021 |
271.696 |
| Jul 2021 |
273.003 |
| Aug 2021 |
273.567 |
| Sep 2021 |
274.310 |
| Oct 2021 |
276.589 |
| Nov 2021 |
277.948 |
| Dec 2021 |
278.802 |
| Jan 2022 |
281.148 |
| Feb 2022 |
283.716 |
| Mar 2022 |
287.504 |
| Apr 2022 |
289.109 |
| May 2022 |
292.296 |
| Jun 2022 |
296.311 |
| Jul 2022 |
296.276 |
| Aug 2022 |
296.171 |
| Sep 2022 |
296.808 |
| Oct 2022 |
298.012 |
| Nov 2022 |
297.711 |
| Dec 2022 |
296.797 |
| Jan 2023 |
299.170 |
| Feb 2023 |
300.840 |
| Mar 2023 |
301.836 |
| Apr 2023 |
303.363 |
| May 2023 |
304.127 |
| Jun 2023 |
305.109 |
| Jul 2023 |
305.691 |
| Aug 2023 |
307.026 |
| Sep 2023 |
307.789 |
| Oct 2023 |
307.671 |
| Nov 2023 |
307.051 |
| Dec 2023 |
306.746 |
| Jan 2024 |
308.417 |
| Feb 2024 |
310.326 |
| Mar 2024 |
312.332 |
| Apr 2024 |
313.548 |
| May 2024 |
314.069 |
| Jun 2024 |
314.175 |
| Jul 2024 |
314.540 |
| Aug 2024 |
314.796 |
| Sep 2024 |
315.301 |
| Oct 2024 |
315.664 |
| Nov 2024 |
315.493 |
| Dec 2024 |
315.605 |
| Jan 2025 |
317.671 |
| Feb 2025 |
319.082 |
| Mar 2025 |
319.799 |
| Apr 2025 |
320.795 |
| May 2025 |
321.465 |
| Jun 2025 |
322.561 |
| Jul 2025 |
323.048 |
| Aug 2025 |
323.976 |
| Sep 2025 |
324.800 |
| Oct 2025 |
324.710 |
| Nov 2025 |
324.122 |
| Dec 2025 |
324.054 |
| Jan 2026 |
325.252 |
| Feb 2026 |
326.785 |
| Mar 2026 |
330.213 |
| Apr 2026 |
333.020 |
| May 2026 |
335.123 |
| Jun 2026 |
333.952 |