The Financial Forecast Center is a leading independent resource for accurate, data-driven forecasts across a wide spectrum of financial and economic indicators.
Utilizing state-of-the-art artificial intelligence, FFC provides regularly updated projections for interest rates, exchange rates, stock indexes, inflation, and other key economic metrics.
| As of September 03, 2026 | |||
|---|---|---|---|
| Indicator | Current | Forecast for September |
Forecast for October |
| S&P 500 | 7747.71 | 7852 | 7681 |
| 30 Yr Treasury | 5.25 | 5.29 | 5.13 |
| EUR to USD | 1.163 | 1.156 | 1.151 |
| GBP to USD | 1.353 | 1.351 | 1.346 |
| CAD to USD | 1.379 | 1.393 | 1.397 |
| Gold Price | 4472.10 | 4589 | 4693 |
| Crude Oil Price | 91.72 | 84.4 | 78.3 |
Financial and Economic Forecast Outlook
September 2026
The current outlook points to an October stock-market pullback followed by renewed gains, gradually declining interest rates and inflation, moderate economic growth, and higher precious-metal prices. Forecast values are monthly averages.
U.S. Stock Market Forecast
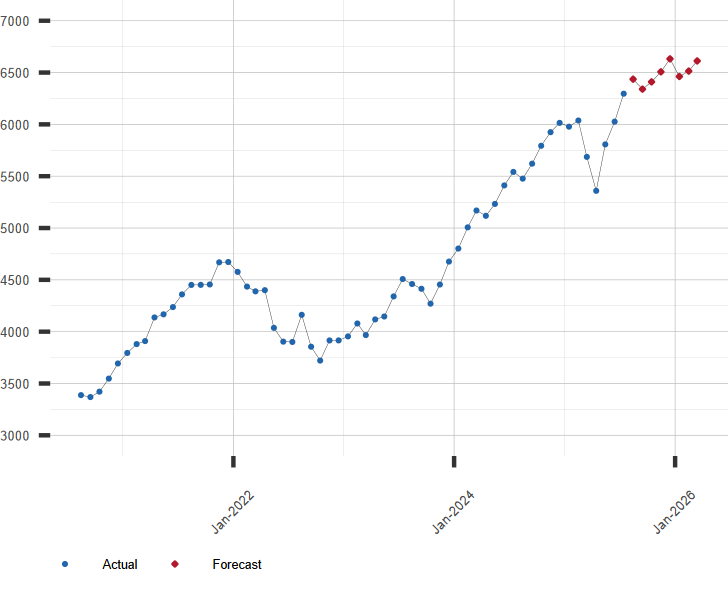
The S&P 500 is projected to decline from 7,852 in September to 7,681 in October before rising to 8,380 by April 2027. The Dow Jones follows a similar path from 54,510 to 53,355 and then 57,690. The Nasdaq Composite is forecast to move from 26,933 to 26,308 and then 29,090, while the Russell 2000 moves from 3,058 to 2,982 and then 3,270.
Interest Rate Forecast
The 10-year Treasury yield is forecast to decline from 4.73% in September to 4.23% by April. The 30-year mortgage rate is projected to fall from 6.70% to 6.20%. The federal funds rate remains at 3.63% through November before declining to 3.28% by March.
Currency Exchange Rate Forecast
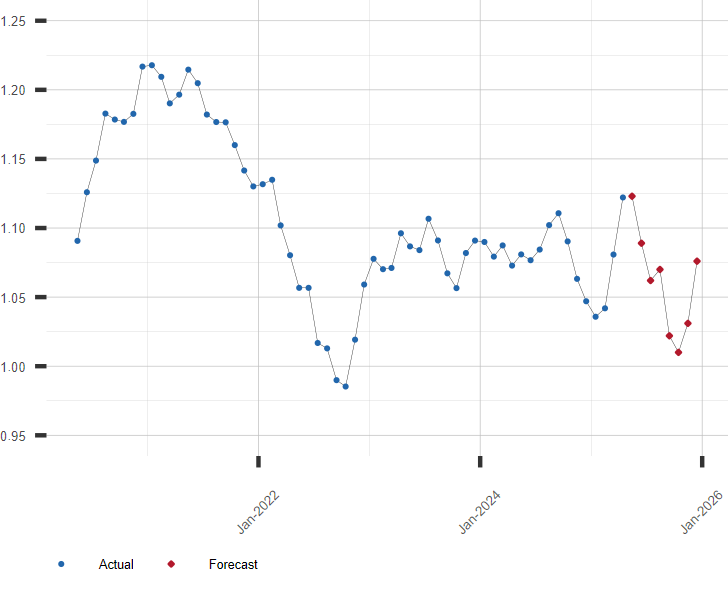
The euro and British pound are forecast to weaken through January before recovering to $1.173 and $1.368 in March. The yen reaches 163.0 per dollar in December before strengthening to 156.1 in March, while the Australian dollar falls to $0.695 in January and recovers to $0.719 in March.
The Chinese yuan is projected to strengthen from 6.72 per dollar in September to 6.65 in March. The Mexican peso is forecast to weaken from 16.88 per dollar in September to 17.63 in January before recovering to 16.99 in March.
U.S. Economic Outlook
Real GDP growth is projected at 1.49% in September, 2.00% during the fourth quarter and 2.06% in early 2027. Inflation is forecast to decline from 3.16% in September to 1.73% in March, while unemployment remains near 4.1% through November before reaching 4.3% in early 2027.
Commodity Price Forecast
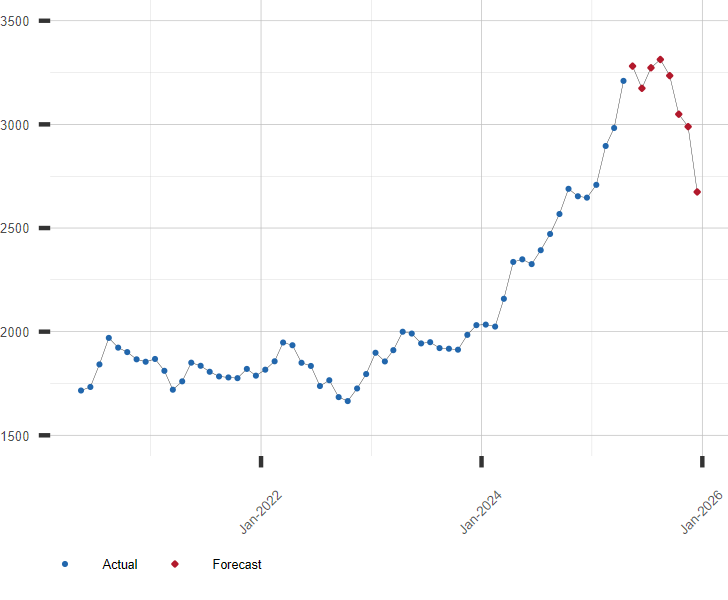
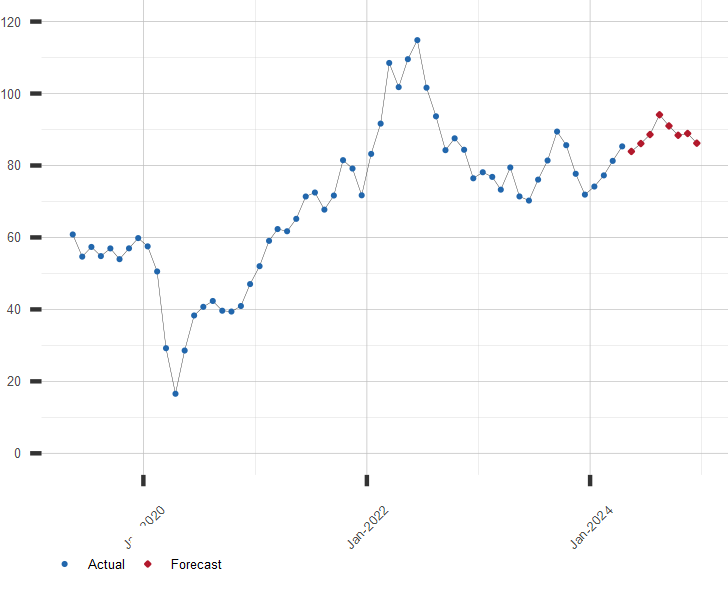
Gold is forecast to rise from $4,589 per ounce in September to $5,007 by April, despite a December pullback. Silver declines from $71.41 in September to $66.03 in October before rising to $73.94 by April. Crude oil is projected to fall from $84.40 per barrel in September to $74.00 in January, recover to $81.80 in March and ease to $77.20 in April.
Forecast values are monthly averages and are subject to estimated margins of error. See the individual forecast pages for complete tables, charts and historical data.
Popular Forecasts
S&P 500 Forecast
EUR/USD Forecast
Gold Price Forecast, USD/t oz
WTI Oil Price Forecast, USD/BBL
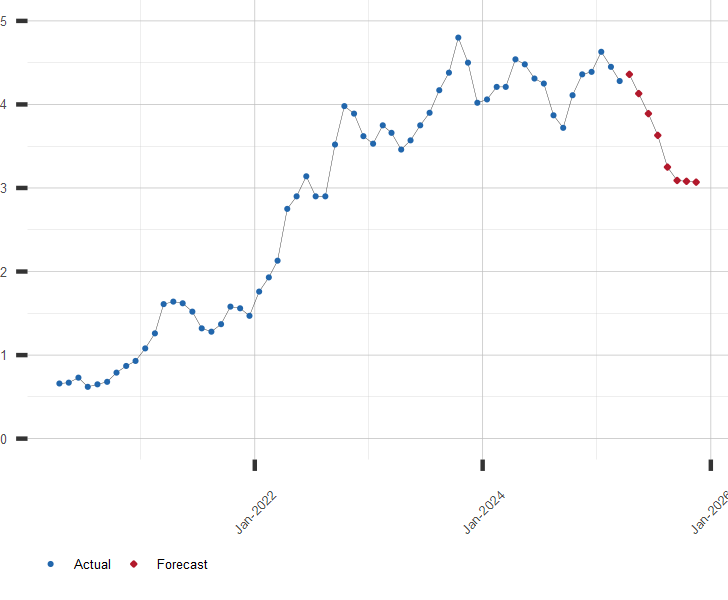
U.S. 10 Year Treasury Rate Forecast, %
Click To See All Stock Market Forecasts
Click To See All Exchange Rate Forecasts
Click To See All Interest Rate Forecasts
Click To See All Commodity Price Forecasts
Click To See All Economic Indicator Forecasts
Click To See Master List of All Forecasts
| September 03, 2026 | |
| Indicator | Value |
|---|---|
| S&P 500 | 7747.71 |
| U.S. GDP Growth, YoY % | 2.10 |
| U.S. Inflation Rate, % | 3.30 |
| Gold Price, $/oz-t | 4472.10 |
| Crude Oil Futures, $/bbl | 91.72 |
| U.S. 10 Year Treasury, % | 4.77 |