Long Range Forecast Sample
One of the most common requests of the Financial Forecast Center is to post actual forecasts over each financial indicator we publish. While it would be tedious and probably confusing to post all prior forecasts, we can present a sample.
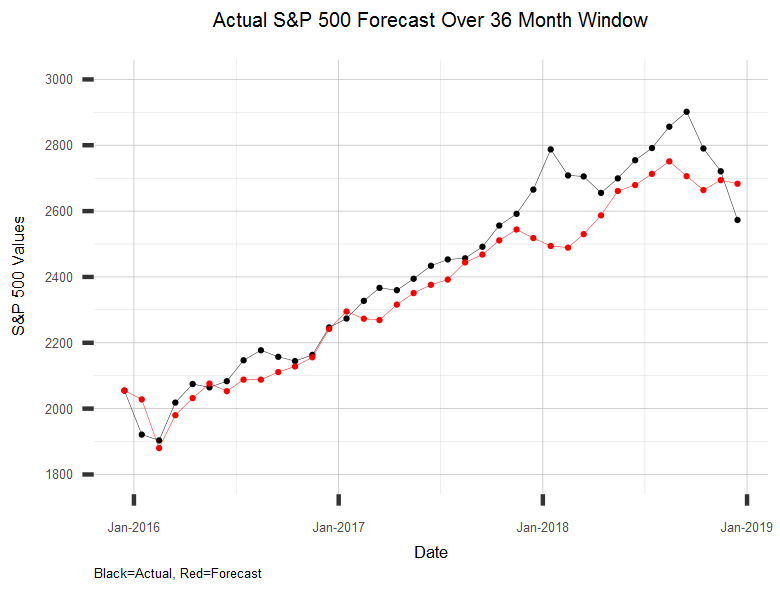
Below is a forecast of the S&P 500 from December 2015 over a 36 month window. The forecast window covers all of 2016, 2017 and 2018. The black line is the actual S&P 500 while the red line is the forecast.

Each forecast value was produced in December 2015, thus the forecast for December 2018 was a forecast for 36 months out (the forecast for December 2017 was for 24 months out, etc.). The average error over the whole 36 month window is 2.9%.
All in all, not bad.
Below is a table of the actual S&P 500, the forecast values and the error (actual minus predicted).
| Month Forward | Date | Actual Value | Forecast Value | Error |
|---|---|---|---|---|
| 0 | Dec 2015 | 2054.83 | 2054.83 | 0.00 |
| 1 | Jan 2016 | 1921 | 2028 | -107 |
| 2 | Feb 2016 | 1903 | 1880 | 23 |
| 3 | Mar 2016 | 2018 | 1980 | 38 |
| 4 | Apr 2016 | 2075 | 2032 | 43 |
| 5 | May 2016 | 2065 | 2076 | -11 |
| 6 | Jun 2016 | 2083 | 2053 | 30 |
| 7 | Jul 2016 | 2147 | 2088 | 59 |
| 8 | Aug 2016 | 2177 | 2088 | 89 |
| 9 | Sep 2016 | 2157 | 2111 | 46 |
| 10 | Oct 2016 | 2144 | 2128 | 16 |
| 11 | Nov 2016 | 2163 | 2156 | 7 |
| 12 | Dec 2016 | 2247 | 2242 | 5 |
| 13 | Jan 2017 | 2274 | 2295 | -21 |
| 14 | Feb 2017 | 2327 | 2273 | 54 |
| 15 | Mar 2017 | 2367 | 2269 | 98 |
| 16 | Apr 2017 | 2360 | 2316 | 44 |
| 17 | May 2017 | 2394 | 2351 | 43 |
| 18 | Jun 2017 | 2434 | 2376 | 58 |
| 19 | Jul 2017 | 2453 | 2392 | 61 |
| 20 | Aug 2017 | 2457 | 2444 | 13 |
| 21 | Sep 2017 | 2492 | 2468 | 24 |
| 22 | Oct 2017 | 2556 | 2511 | 45 |
| 23 | Nov 2017 | 2592 | 2544 | 48 |
| 24 | Dec 2017 | 2665 | 2518 | 147 |
| 25 | Jan 2018 | 2787 | 2494 | 293 |
| 26 | Feb 2018 | 2708 | 2489 | 219 |
| 27 | Mar 2018 | 2705 | 2530 | 175 |
| 28 | Apr 2018 | 2655 | 2587 | 68 |
| 29 | May 2018 | 2699 | 2661 | 38 |
| 30 | Jun 2018 | 2754 | 2679 | 75 |
| 31 | Jul 2018 | 2791 | 2713 | 78 |
| 32 | Aug 2018 | 2856 | 2751 | 105 |
| 33 | Sep 2018 | 2902 | 2706 | 196 |
| 34 | Oct 2018 | 2790 | 2664 | 126 |
| 35 | Nov 2018 | 2721 | 2694 | 27 |
| 36 | Dec 2018 | 2573 | 2683 | -110 |
If you would like details on how to subscribe to FFC's long range forecasts, please see our subscription page.