The Financial Forecast Center™
Happy 250th Birthday, America!
After observing certain financial or economic indicators, you have probably said to yourself "Wow the price of X seems to behave a lot like Y." Well, you may be right.
If each financial indicator is likened to be a piece of a jig saw puzzle, there has to be a way of putting the pieces together. One technique of putting the myriad of pieces (indicators) together is a heirarchical cluster analysis. What indicators cluster together?
What follows is a hierarchical cluster analysis of the financial markets and U.S. economy.
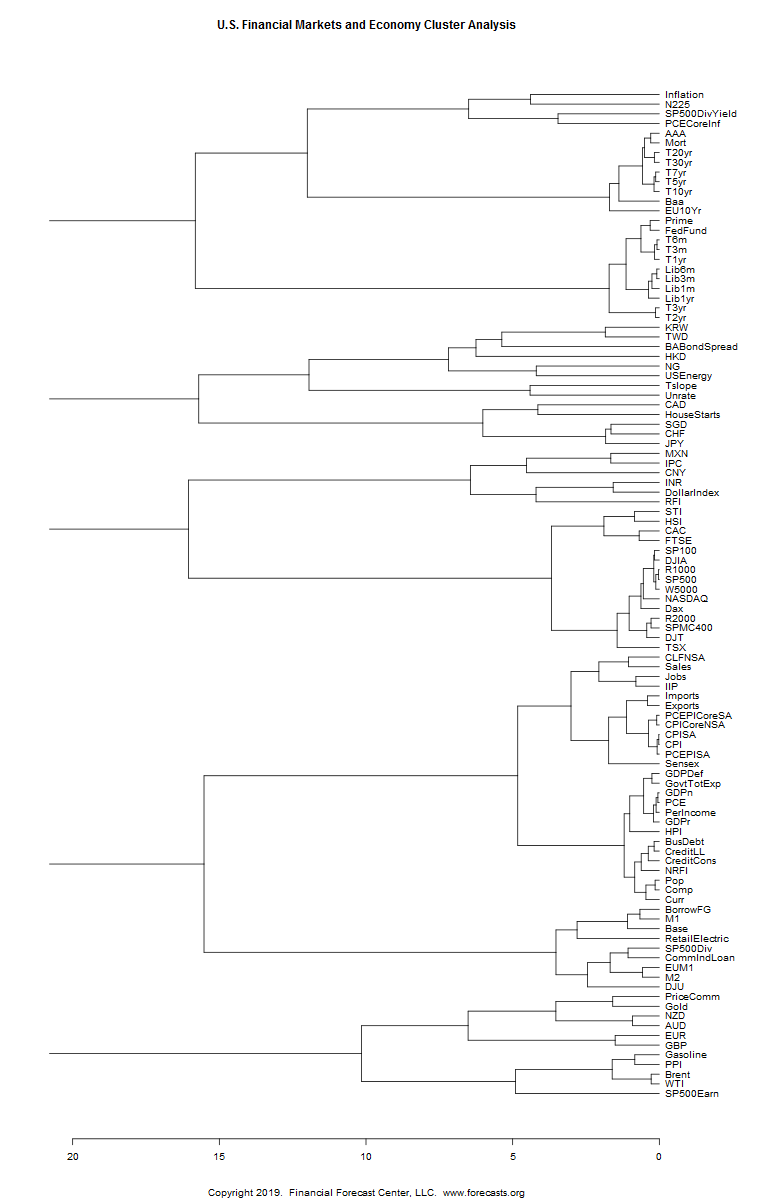
The graph, or dendrogram, below shows the similarity between many different financial market and economic indicators. The indicators are given along the right hand side. The scale along the bottom is the measure of similarity between the various indicators, or factors. The location of the bar where two factors split is where the measure of similarity is taken.
As an example of how to read the dendogram, take the New Zealand Dollar, NZD, and Australian Dollar, or AUD, shown near the bottom. The AUD and NZD cluster together and the measure of similarity is very close at about 1 (out of a maximum of 16). This can be interpreted as the AUD and NZD behave similarly, or there is an association between them.
This dendrogram is interesting for two reasons: 1) It's comprehensive and 2) There are some very interesting associations between some indicators.
Below the chart, I point out some of the interesting clusters and give my interpretation.
The first part of producing these clusters is finding the dissimilarity between the various indicators (also called factors or series). The dissimilarities are found using an adaptive dissimilarity index, a technique well suited to time series.
The second part is producing the heirarchical clusters. These clusters are then plotted as a dendrogram.
You will notice in the dendrogram above, there are five main clusters. Each cluster has many sub-clusters.
1) As pointed out above, the NZD/USD and AUD/USD cluster together. The EUR/USD and GBP/USD also cluster together. These two currency clusters are also part of a larger commodity price cluster (crude oil and gold price).
2a) The bottom cluster contains commodity prices (gold, oil and commodity price index). This cluster also contains a number of currency exchange rates, showing a dependence of exchange rates on commodity prices, or vice versa.
2b) The commodity price cluster also contains the S&P 500 earnings per share. It appears the S&P 500 earnings are highly dependent on crude oil and gasoline (petrol) prices.
3) The Singapore Straits Times and Hang Seng stock indexes are together. These asian stock indexes also cluster with the U.K. FTSE and French CAC. It's interesting that the FTSE and CAC do not cluster with the German DAX.
4) The S&P 100, S&P 500, DJIA, Russell 1000, Wilshire 5000, NASDAQ Composite and DAX cluster togther. These stock indexes are essentially the same.
5) The S&P 500 dividend yield clusters with the personal consumption expenditures price index inflation rate. It appears the dividend yield 'competes' with the PCE inflation rate.
6) The top most cluster is a cluster of interest rates. Within this cluster, the short end (term) of the U.S. treasury yield curve forms one sub-cluster, while the long end (term) of the yield curve forms another sub-cluster.
6a) Contained within the short term yield cluster is also the Fed Funds rate, prime interest rate and LIBORS (USD). Because the Fed Funds rate is set by the U.S. Federal Reserve, it appears the Federal Reserve dictates the treasury yield curve out to a term of 3 years, and they dictate the USD based LIBORS.
6b) Contained within the longer term yield cluster are two measures of inflation: 1) PCE core inflation and 2) CPI inflation. It appears the long end of the yield curve (5 years to 30 years) competes with, or is set by, the U.S. inflation rate.
Kyle Atkinson, Financial Forecast Center.