Financial market research
Cluster Analysis of Financial Markets and the U.S. Economy
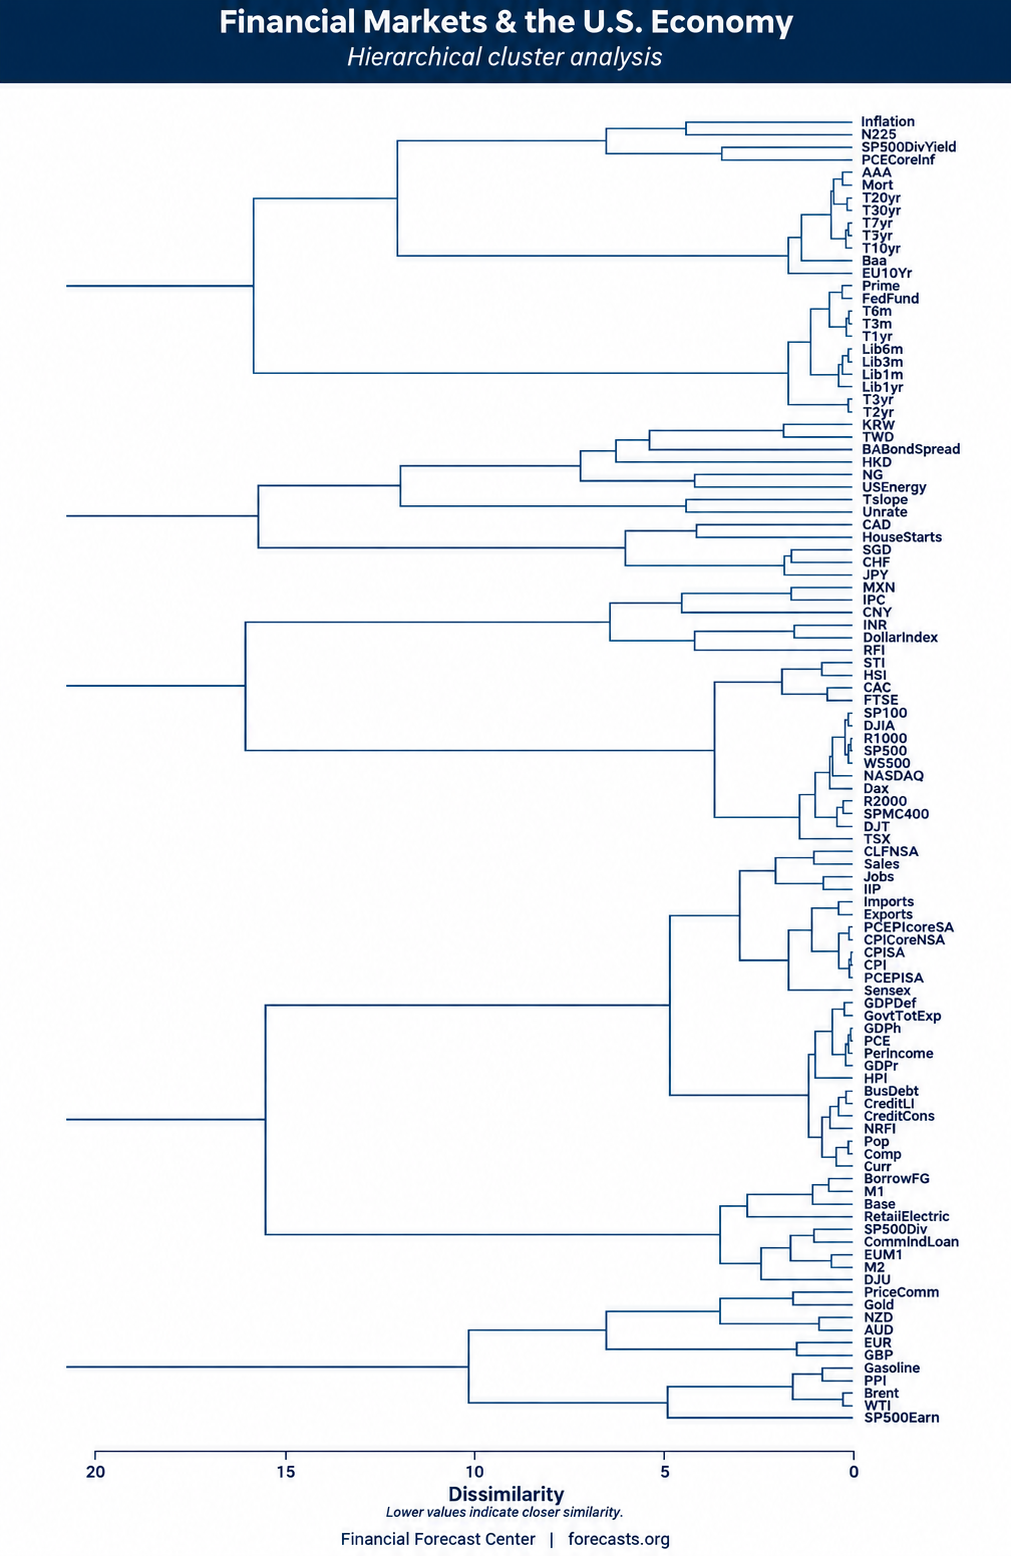
Which financial markets and economic indicators behave alike? Hierarchical cluster analysis groups similar time series into a branching chart called a dendrogram. This study brings stock indexes, interest rates, exchange rates, commodity prices and U.S. economic indicators into one view.
The chart reveals recognizable groups, including U.S. stock indexes, short-term interest rates, and commodity-linked currencies. It also highlights less obvious associations, such as the grouping of S&P 500 earnings with energy prices. The sections below explain how to read the chart, how the clusters are formed, and what the findings suggest.
How to read a financial market dendrogram
Each label on the right identifies a financial or economic time series. Follow its branch to the left to see where it joins another indicator or group. That joining point shows the dissimilarity at which the series or clusters merge.
- Find the indicators. Locate their abbreviations on the right side of the chart. The complete indicator legend explains the codes.
- Trace their connecting branches. A pair may join directly or become connected as part of a larger group.
- Read the horizontal scale. Zero is on the right, with larger values to the left. A lower joining value means closer similarity; a higher value means greater dissimilarity.
For example, the Australian dollar (AUD) and New Zealand dollar (NZD) join near the right edge, at a dissimilarity of about 1. They behave similarly under the measure used here. Their pair then joins a broader group that includes other currencies and commodity prices.
Financial markets and U.S. economy: the cluster chart
The dendrogram displays five main groups, each containing smaller clusters. The findings below focus on the relationships within those groups.
Open the full-size dendrogram View the complete indicator legend
How hierarchical cluster analysis works
The analysis has two stages: measuring the dissimilarity between time series and organizing those measurements into hierarchical clusters.
- Measure
- An adaptive dissimilarity index compares the indicator series.
- Group
- Hierarchical clustering organizes the series into nested groups according to their dissimilarities.
- Display
- A dendrogram shows the groups and the dissimilarity levels at which their branches join.
The adaptive dissimilarity index developed by Douzal Chouakria and Nagabhushan considers both the proximity of time-series values and similarities in their growth behavior. This provides a way to compare how indicators behave over time.
The resulting chart brings several kinds of financial and economic data together. It allows us to examine familiar groupings, such as related equity indexes, alongside associations between different categories of indicators.
Key clusters and findings
1. Currencies and commodities form a broad cluster
The Australian and New Zealand dollars form a close pair. The euro (EUR) and British pound (GBP) also cluster together. Both pairs belong to the broader group at the bottom of the chart, alongside gold, crude oil and other commodity-price measures.
This grouping highlights an association between currency behavior and commodity prices. Reading the smaller branches within it helps distinguish the closest currency pairs from the broader commodity-related group.
2. S&P 500 earnings cluster with energy prices
S&P 500 earnings per share (SP500Earn) appear in the bottom cluster with crude oil and gasoline prices. This association suggests a connection between corporate earnings and the energy-price environment. The chart places earnings in this commodity-related group rather than alongside the S&P 500 price index.
3. Global stock indexes divide into distinct groups
The Singapore Straits Times Index (STI) and Hong Kong's Hang Seng Index (HSI) cluster together. They join a group that also includes France's CAC 40 and the U.K. FTSE 100.
The German DAX appears with a different set of indexes: the S&P 100, S&P 500, Dow Jones Industrial Average, Russell 1000, Wilshire 5000 and NASDAQ Composite. These indexes display closely related behavior in the analysis. The split is particularly interesting because the DAX groups with U.S. indexes rather than with the FTSE and CAC.
4. Dividend yield clusters with core PCE inflation
The S&P 500 dividend yield (SP500DivYield) joins core PCE inflation (PCECoreInf) near the top of the dendrogram. This pairing highlights a relationship between the income yield on equities and an inflation measure.
5. Short-term interest rates cluster together
The uppermost main group contains a distinct cluster of shorter-term Treasury yields. The federal funds rate, prime rate and U.S. dollar LIBOR series also appear in this group.
This pattern suggests a close relationship between monetary-policy rates and the short end of the yield curve. Within the chart, Treasury maturities extending to three years belong to this shorter-term grouping.
6. Longer-term yields form a separate interest-rate group
Treasury yields from five to thirty years form a separate group within the upper cluster, alongside other longer-term borrowing-rate measures. Inflation indicators occupy another branch of the same broad cluster.
The structure separates short-term and long-term rate behavior while placing inflation nearby in the larger hierarchy. It offers a way to examine how different sections of the yield curve relate to other financial indicators.
What the clusters tell us
Cluster analysis turns a large collection of indicators into a map of related behavior. It shows which series are close neighbors, which form broader groups, and where seemingly similar indicators follow different patterns.
The most useful detail is often in the smaller branches: AUD and NZD form a close pair, U.S. equity indexes group together, and shorter-term interest rates separate from longer-term yields. Following those branches outward shows how each relationship fits into the wider financial and economic system.