How Global Stock Markets Are Connected
Are stock markets around the world connected? This study finds that all 18 stock market indexes belong to one connected network. The model links markets in Asia, Europe and the Americas, showing how movements in one index may help explain movements in another.
The analysis uses daily changes in closing values from January 4, 2007, through October 23, 2015. A Bayesian network maps the relationships among these indexes. Under the model's causal interpretation, its arrows imply causation: movements in one market influence movements in another within the study period.
Why study connections between stock markets?
This study asks whether major stock markets form a connected network and whether some indexes appear upstream of others. It also examines several market observations and commonly repeated claims:
- Does the Dow Jones Transportation Average lead the broader U.S. market?
- Does Singapore's Straits Times Index act as an early indicator for other markets?
- Do the links follow the trading day from Asia through Europe to the Americas?
- Do connections involving China help explain the recent global market declines of August and September 2015?
These questions guide the investigation. The aim is to examine the relationships among stock indexes themselves and see which observations the network supports.
Data and method: a Bayesian network of 18 indexes
A Bayesian network represents relationships among variables with nodes and directed links. Here, each node represents a stock market index, and the links describe the dependencies found by the model.
- Study period
- January 4, 2007–October 23, 2015
- Input data
- Daily changes in stock index closing values
- Markets
- 18 indexes, including seven U.S. indexes and 11 other markets
- Network search
- Tabu search
The period covers the years before the Great Recession through the recovery. The analysis includes only stock indexes. It does not include economic growth, interest rates, exchange rates or money supplies as separate variables.
The analysis uses Tabu search to identify the network structure. For technical background, see the documentation on Tabu search for Bayesian network structure learning.
How stock markets are connected: the network diagram
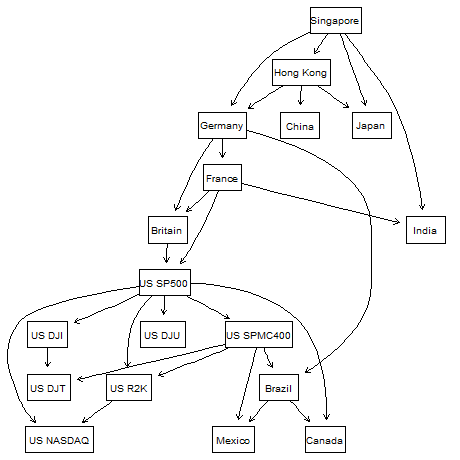
The diagram contains 18 stock market indexes and 27 directed links. Read each arrow from its source box to its destination. For example, Hong Kong → China is a direct link, while Hong Kong → Germany → France is a chain of links.
Stock market index legend
Blue boxes represent U.S. indexes; teal boxes represent other markets. The labels below match the diagram.
- US SP500
- S&P 500
- US DJI
- Dow Jones Industrial Average
- US DJT
- Dow Jones Transportation Average
- US DJU
- Dow Jones Utility Average
- US NASDAQ
- NASDAQ Composite
- US SPMC400
- S&P MidCap 400
- US R2K
- Russell 2000
- Singapore
- Straits Times Index
- Japan
- Nikkei 225
- Hong Kong
- Hang Seng Index
- China
- Shanghai Composite
- Germany
- DAX
- France
- CAC 40
- Britain
- FTSE 100
- India
- BSE Sensex
- Canada
- TSX Composite
- Mexico
- IPC
- Brazil
- Bovespa Index
A market with no connections would appear as an isolated box; none does in this model. A box with no outgoing arrows is a leaf node, which is still connected to the markets pointing into it.
What the stock market network shows
- All 18 indexes are connected. Some pairs have a direct link; others are connected through intermediate markets. Being in the same network does not mean every market directly influences every other market.
- Singapore is the root node. No arrows point into Singapore, while arrows lead from it to Japan, Hong Kong, Germany and India. This position suggests that Singapore serves as a potential early indicator for other markets—a "canary in the coal mine."
- Several paths run from Asia through Europe to the Americas. One example is Singapore → Hong Kong → Germany → France → US SP500. The graph is consistent with that geographic ordering, but it does not measure cross-border money flows.
- The S&P 500 is upstream of the Dow transports. The model links US SP500 to US DJI and US SPMC400, both of which point to US DJT. It does not show the transports leading the S&P 500.
- U.S. small- and mid-cap indexes are downstream of the S&P 500. US SP500 points to US SPMC400, which points to US R2K. This is a relationship in the fitted sample, rather than evidence of a dependable trading signal.
- The NASDAQ Composite is a leaf node. US SP500 and US R2K point into US NASDAQ, and no arrows leave it. This describes NASDAQ's position in this particular network, not a general rule about its influence.
- China is downstream of Hong Kong. Hong Kong points to China, while China has no outgoing links in the diagram. This result bears on the question of China's role in the recent selloff: the network places Hong Kong upstream of China, rather than showing China as the source of the broader market decline.
- Other markets have distinct paths. France and US SPMC400 point to Mexico; Mexico and Germany point to Brazil; Britain and US SP500 point to Canada. The Americas do not form a single, uniform sequence.
What causation does the network imply?
Under the model's causal interpretation, the network implies causation among the connected stock markets. Each directed arrow represents an inferred causal influence from its source market to its destination, while a chain of arrows represents a path of indirect influence through intermediate markets.
This study does not include non-market drivers or report an out-of-sample forecasting test.
The network provides a map of how stock markets relate to one another over the study period. It identifies direct connections, chains of influence and the position of each index within the broader system. As new data become available, further analysis can test how these relationships evolve.