10-Year Treasury Yield Forecast
10-Year Treasury Yield Forecast Summary
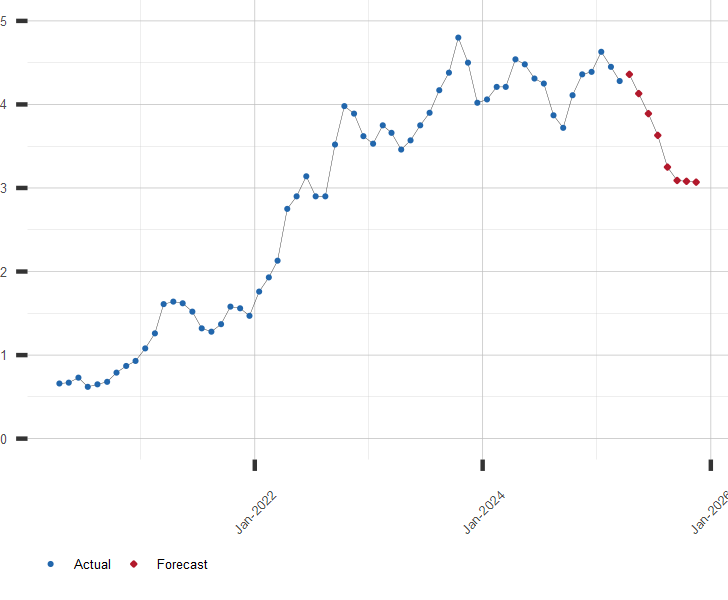
The monthly 10-year U.S. Treasury yield forecast rises from 5.02% in November 2026 to a forecast high of 5.20% in January 2027, then fluctuates at lower levels through June.
The lowest projected monthly average is 4.85% in May 2027. The forecast ends at 4.88% in June 2027, which is 0.14 percentage points below the November projection.
See the monthly forecast and average error estimates, 10-year Treasury yield trend chart, downloadable historical and forecast data and forecast methodology.
Yields on U.S. Treasury securities with a 10-year maturity are expressed in percent per year and represent monthly averages.
10-Year Treasury Yield Forecast Values by Month
U.S. Treasury securities with a 10-year maturity. Percent per year. Monthly averages.
| Month | Date | Forecast Value | Avg Error |
|---|---|---|---|
| 1 | Nov 2026 | 5.02 | ±0.078 |
| 2 | Dec 2026 | 5.17 | ±0.10 |
| 3 | Jan 2027 | 5.20 | ±0.11 |
| 4 | Feb 2027 | 5.05 | ±0.12 |
| 5 | Mar 2027 | 5.07 | ±0.13 |
| 6 | Apr 2027 | 4.93 | ±0.14 |
| 7 | May 2027 | 4.85 | ±0.14 |
| 8 | Jun 2027 | 4.88 | ±0.15 |
Download Historical and Forecast Data
FFC Long Range Forecasts
See the 10-year Treasury yield outlook for the next 5 years
Get the longer-term picture for 10-year Treasury yields, plus other interest rates, stock indexes, currencies, commodity prices, and the economy.
- Access to all FFC long-range forecasts
- Forecasts extending 60 months into the future
- Updated monthly throughout your subscription
$38.95
USD for 12 months of access
Subscribe for $38.95 / year View a sample 5-year forecast60-day money-back guarantee
10-Year Treasury Yield Trend Chart with Forecast
Percent per year. Includes historical and forecast monthly averages.
Related Treasury Yield Forecasts and Data
| November 10, 2026 | |
| Indicator | Rate, % |
|---|---|
| Prime Rate | 7.00 |
| 30 Year Treasury Bond | 5.35 |
| 10 Year Treasury Note | 4.98 |
| 91 Day Treasury Bill | 4.30 |
| Fed Funds | 3.88 |
| SOFR | 3.88 |
| 30 Year Mortgage Rate | 7.18 |