U.S. Unemployment Rate Forecast
Below is a detailed forecast of the U.S. unemployment rate by month.
This forecast is based on prior values of the unemployment rate along with other factors such as total business sales, gross domestic product and interest rates.
U.S. Unemployment Rate Forecast Values
Percent Unemployed, Seasonally Adjusted.
| Month | Date | Forecast Value | Avg Error |
|---|---|---|---|
| 0 | May 2026 | 4.3 | ±0.0 |
| 1 | Jun 2026 | 4.3 | ±0.08 |
| 2 | Jul 2026 | 4.4 | ±0.1 |
| 3 | Aug 2026 | 4.3 | ±0.1 |
| 4 | Sep 2026 | 4.4 | ±0.1 |
| 5 | Oct 2026 | 4.4 | ±0.1 |
| 6 | Nov 2026 | 4.5 | ±0.2 |
| 7 | Dec 2026 | 4.5 | ±0.2 |
| 8 | Jan 2027 | 4.6 | ±0.2 |
Get the Rest of the Story with the 5 Year Forecast!
Chart of U.S. Unemployment Rate
Percent Unemployed, Seasonally Adjusted.
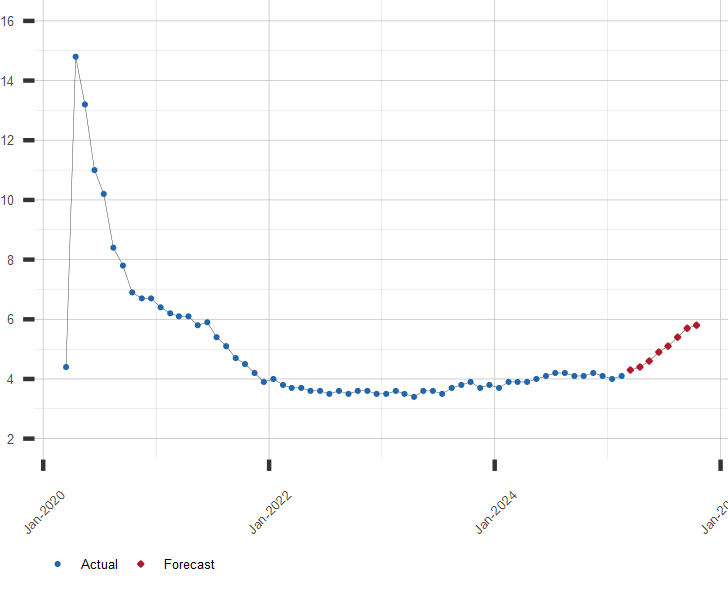
The U.S. Unemployment Rate
The U.S. U-3 unemployment rate is the "official" unemployment rate and is just one of many measures of the employment situation within the United States. This closely followed statistic is released monthly by the Bureau of Labor Statistics.
The U-3 unemployment rate is the total unemployed as a percent of the civilian labor force. For the U-3 measure, the unemployed are persons who are available to take a job and have actively searched for work in the prior 4 weeks but have not found work. The U-3 unemployment rate typically falls between the narrowest measure of unemployment which is the U-2 rate and the broadest measure of unemployment which is the U-6 rate.
Other Employment Resources:
A long range forecast for the U.S. Unemployment Rate and nonfarm payrolls is available by subscription. Click here for more information or to subscribe.
| June 29, 2026 | |
| Indicator | Value |
|---|---|
| S&P 500 | 7440.43 |
| U.S. GDP Growth, YoY % | 2.68 |
| U.S. Inflation Rate, % | 4.25 |
| Gold Price, $/oz-t | 4016.96 |
| Crude Oil Futures, $/bbl | 70.42 |
| U.S. 10 Year Treasury, % | 4.38 |