Dow Jones Industrial Average Forecast
Below is a forecast of the Dow Jones Industrial Average, or DJIA, broken down by month. This forecast is produced based on prior values of the Dow Jones along with other factors such as other stock markets, interest rates, currency exchange rates, and economic indicators. To learn more about how this forecast is produced, please see our methodology page.
Dow Jones Industrial Average Forecast Values
Index Values, Average of Month.
| Month | Date | Forecast Value | Avg Error |
|---|---|---|---|
| 0 | May 2026 | 49895.37 | ±0.00 |
| 1 | Jun 2026 | 51411.0 | ±365.0 |
| 2 | Jul 2026 | 51978.0 | ±417.7 |
| 3 | Aug 2026 | 52587.0 | ±448.5 |
| 4 | Sep 2026 | 53030.0 | ±470.4 |
| 5 | Oct 2026 | 52060.0 | ±487.3 |
| 6 | Nov 2026 | 53060.0 | ±501.2 |
| 7 | Dec 2026 | 54380.0 | ±512.9 |
| 8 | Jan 2027 | 55070.0 | ±523.0 |
Get the Rest of the Story with the 5 Year Forecast!
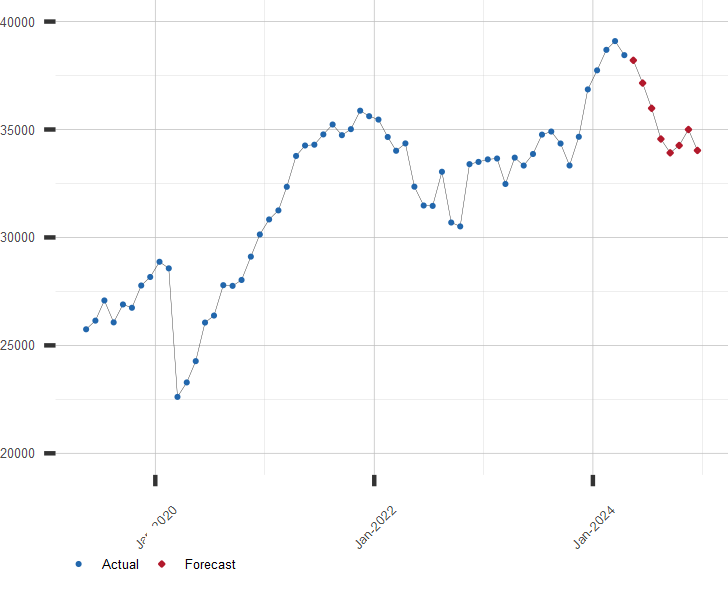
Chart of Dow Jones Industrial Average with Forecast
Average of Month
Other Stock Market Links of Interest:
A long range forecast for the Dow Jones Industrial Average and similar financial series is available by subscription. Click here to subscribe to the DJIA Extended Forecast.
| June 29, 2026 | ||
| Stock Market | Value | Change |
|---|---|---|
| U.S. S&P 500 | 7,440.43 | 1.18% |
| Japan Nikkei 225 | 69,468.11 | 0.15% |
| Hong Kong Hang Seng | 23,026.68 | 1.57% |
| UK FTSE 100 | 10,484.22 | -0.23% |
| German DAX | 24,626.89 | -0.18% |
| Brazil Bovespa | 173,205.34 | -0.05% |