Forecast of U.S. Federal Government Public Debt
U.S. Federal Government Debt Held by Public Forecast
Billion US Dollars. End of Month.
| Month | Date | Forecast Value | Avg Error |
|---|---|---|---|
| 0 | Jun 2026 | 31681.31 | ±0.00 |
| 1 | Jul 2026 | 31874.0 | ±55.0 |
| 2 | Aug 2026 | 32268.0 | ±63.6 |
| 3 | Sep 2026 | 32524.0 | ±68.6 |
| 4 | Oct 2026 | 32831.0 | ±72.2 |
| 5 | Nov 2026 | 33052.0 | ±75.0 |
| 6 | Dec 2026 | 33154.0 | ±77.2 |
| 7 | Jan 2027 | 33291.0 | ±79.1 |
| 8 | Feb 2027 | 33457.0 | ±80.8 |
Get the Rest of the Story with the 5 Year Forecast!
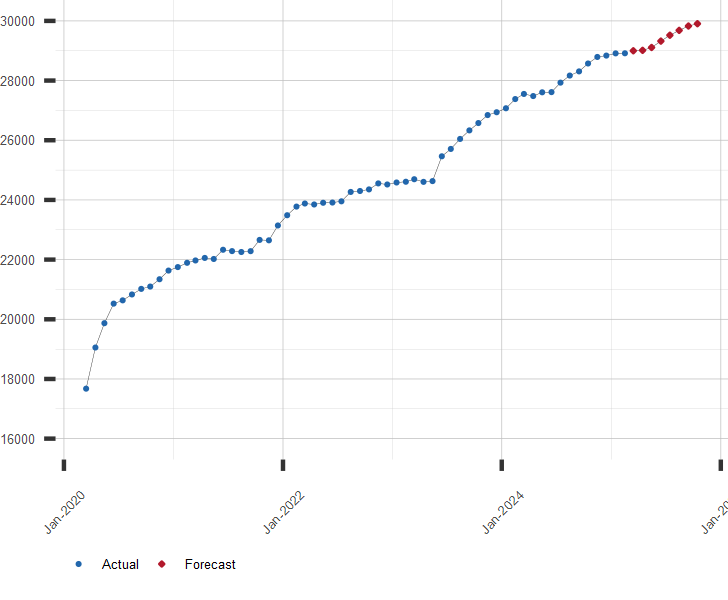
Chart of Federal Government Public Debt
US Federal Debt Held by Public. Billion USD.
Other Government Debt Resources:
A long range forecast for US Federal Debt and similar economic series is available by subscription. Click here for more information or to subscribe.
| July 16, 2026 | |
| Indicator | Value |
|---|---|
| S&P 500 | 7533.77 |
| U.S. GDP Growth, YoY % | 2.68 |
| U.S. Inflation Rate, % | 3.53 |
| Gold Price, $/oz-t | 3975.20 |
| Crude Oil Futures, $/bbl | 78.95 |
| U.S. 10 Year Treasury, % | 4.57 |