CAPEX Capital Expenditures Forecast
Private Nonresidential Fixed Investment Forecast Values
Billion US Dollars. Annual Rate, Seasonally Adjusted.
| Month | Date | Forecast Value | Avg Error |
|---|---|---|---|
| 0 | Mar 2026 | 4485.07 | ±0.00 |
| 1 | Apr 2026 | 4571.1 | ± 9.6 |
| 2 | May 2026 | 4571.1 | ± 9.6 |
| 3 | Jun 2026 | 4571.1 | ± 9.6 |
| 4 | Jul 2026 | 4656.5 | ±13.8 |
| 5 | Aug 2026 | 4656.5 | ±13.8 |
| 6 | Sep 2026 | 4656.5 | ±13.8 |
| 7 | Oct 2026 | 4738.2 | ±15.4 |
| 8 | Nov 2026 | 4738.2 | ±15.4 |
Get the Rest of the Story with the 5 Year Forecast!
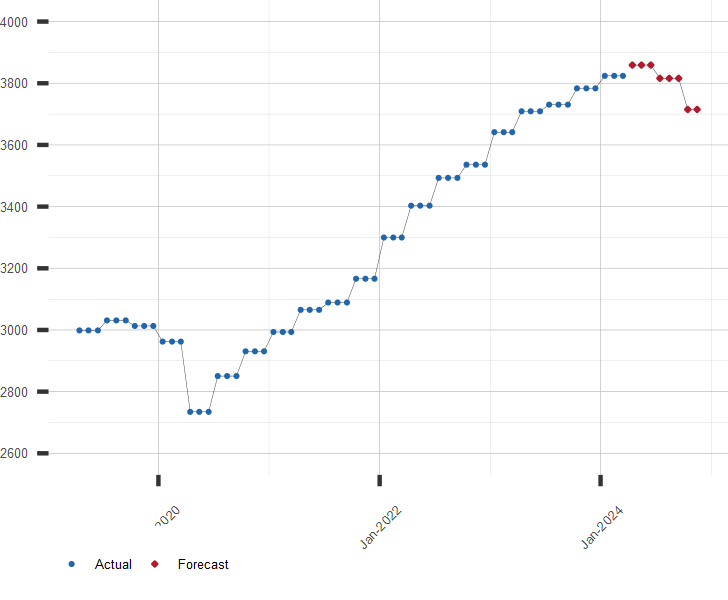
Chart of U.S. Capital Investment
Billion US Dollars. Annual Rate, Seasonally Adjusted.
Other CAPEX and Capital Investment Resources:
A long range forecast for this and similar economic series is available by subscription. Click here for more information on Fixed Private Investment Forecast or to subscribe now
| June 25, 2026 | |
| Indicator | Value |
|---|---|
| S&P 500 | 7357.49 |
| U.S. GDP Growth, YoY % | 2.68 |
| U.S. Inflation Rate, % | 4.25 |
| Gold Price, $/oz-t | 4026.92 |
| Crude Oil Futures, $/bbl | 71.47 |
| U.S. 10 Year Treasury, % | 4.40 |