Forecast of India's BSE Sensex Stock Index
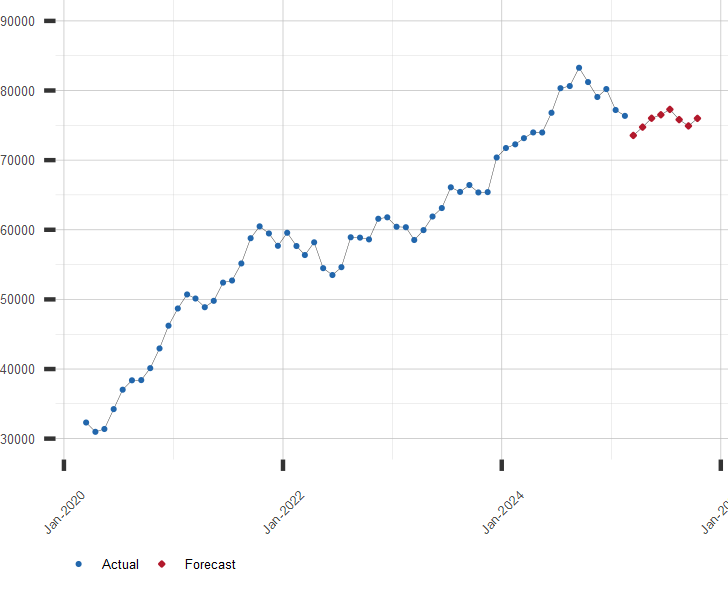
BSE Sensex Stock Index Forecast Values
Stock Price Index Values, Average of Month.
| Month | Date | Forecast Value | Avg Error |
|---|---|---|---|
| 1 | Nov 2026 | 75730.0 | ±1030.0 |
| 2 | Dec 2026 | 76563.0 | ±1306.6 |
| 3 | Jan 2027 | 77860.0 | ±1468.3 |
| 4 | Feb 2027 | 78825.0 | ±1583.1 |
| 5 | Mar 2027 | 80071.0 | ±1672.2 |
| 6 | Apr 2027 | 78473.0 | ±1744.9 |
| 7 | May 2027 | 80251.0 | ±1806.4 |
| 8 | Jun 2027 | 81977.0 | ±1859.7 |
Download Historical and Forecast Data
Chart of BSE Sensex Index with Forecast
Share Price Index Values, Average of Month.
Other BSE Sensex Resources:
A long range forecast for the BSE Sensex and similar financial series is available by subscription. Click here for more information or to subscribe.
| November 11, 2026 | ||
| Stock Market | Value | Change |
|---|---|---|
| U.S. S&P 500 | 7,619.38 | 1.31% |
| Japan Nikkei 225 | 61,248.59 | 1.31% |
| Hong Kong Hang Seng | 24,315.92 | -0.98% |
| UK FTSE 100 | 10,835.47 | 0.78% |
| German DAX | 26,662.77 | 1.20% |
| Brazil Bovespa | 172,060.44 | 0.42% |