How Global Stock Markets Cause Other Stock Markets
Introduction
This is an interesting exercise in determining how various stock markets around the world influence or predict other stock markets.
While there can be various factors that drive a stock market up or down, one of these factors may be another stock market half way around the globe.
The question asked here is: are all of the major stock markets around the world connected, and if so, how are they connected? Do movements in one stock market in one country predict, lead, influence, or cause movements in another stock market in another country.
What follows answers this question and presents some surprising findings.
Myths and Rumors of Myths
There are sayings, or platitudes, that seem to go back to biblical times. The problem is they are told and retold so often they are taken as fact. Most people don't know how they started, where they came from, or if they are even true. Today, however, researchers and analysts are equipped with tools and a quality and quantity of data that were unimaginable even 30 years ago. These tools allow us to put some of these sayings to the test to determine their truthiness.
One of these sayings is "The Dow Jones Transportation Average predicts the broader markets." Well, let's put that to the test.
Another platitude espoused by the media during the market swoon in August and September of 2015 was that the coordinated global stock market drop was caused by the stock market bubble in China popping. Let's put that to the test, too.
Here are a few personal observations from watching the stock markets for over 20 years:
- All of the major stock markets around the world are interconnected.
- Money flows from country to country around the world, following the sun, as the trading day progresses.
- The Singapore Straits Times is the "canary in the coal mine". Singapore will move before other markets.
- China causes the stock market in Brazil to move up or down.
These are mere personal observations, but let's put these observations to the test as well.
Motivation
The purpose of this exercise is to see if, first, there truly are links between the various stock markets, and second, how the stock markets around the world might be connected and influence each other.
Technical Stuff
One technique to determine causation (what causes what) is a Bayesian causal network. Without going into the detailed theory and math here, a great explanation of Bayesian causal networks can be found on Wikipedia. Basically, this technique looks at the probability of one thing happening given the probability of many other things happening. The production of a causal network infers links between one variable, or factor, and another.
For the sake of the analysis here, each "thing", factor, or variable, is a stock market index. Some of the indexes used are different indexes within the U.S while all other indexes are the main stock market indicators for many major countries around the globe.
The analysis presented here only uses stock market indexes--no other factors such as economic growth, interest rates, exchange rates, or money supplies were used. Just the stock markets were singled out to test only how various stock markets might be connected.
A Stock Market Causal Network
Below is a causal network of various major stock markets around the world. These include the U.S., China, Japan, Germany, the U.K., and Brazil.
What is shown in the diagram below are the links between various stock markets. Each rectangle represents the stock market for a particular country. Between the rectangles are lines, usually with arrows. Each line shows a link between the stock markets, while the arrow shows the direction of causation between the markets.
For instance, the line between "Hong Kong" and "China" shows there is a causal connection between the two stock markets. The direction of the arrow moving from "Hong Kong" to "China" shows that the Hong Kong stock market is one of the causes of the Chinese stock market.
If any of the stock markets are independent, they will be represented by a box with no lines connected to it (it will be sitting by itself).
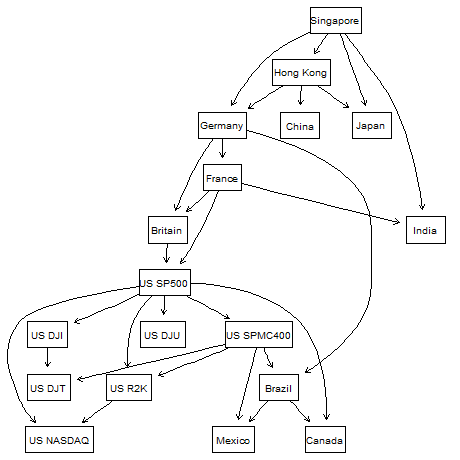
Legend:
- US SP500 - U.S. S&P 500, a broad market indicator.
- US DJI - U.S. Dow Jones Industrial Average, a large cap indicator.
- US DJT - U.S. Dow Jones Transportation Average, included to test a hypothesis.
- US DJU - U.S. Dow Jones Utility Average, included to test a hypothesis.
- US NASDAQ - U.S. NASDAQ Composite, broad market indicator and tech indicator.
- US SPMC400 - U.S. S&P Mid Cap 400, a mid cap indicator.
- US R2K - U.S. Russell 2000, a small cap indicator.
- Germany - German DAX.
- France - French CAC 40.
- Britain - U.K. FTSE 100.
- Singapore - Singapore Straits Times Index.
- Hong Kong - Hang Seng Index
- China - China Shanghai Composite Index.
- India - India BSE Sensex Index.
- Mexico - Mexico IPC Index.
- Canada - Canada TSX Composite.
- Brazil - Brazil Bovespa Index.
Discussion and Conclusions
Below are some conclusions that can be drawn from the causal network shown above. Some are very interesting.
1) All of the major stock markets around the world are connected, usually through a "causal chain". This was clearly demonstrated on August 24th, 2015, when all of the major stock markets dropped significantly at the same time--it was as if a cascade of fear swept around the globe, taking down one market after another.
2) Stock markets around the world are being driven by Asia, not the United States or Europe.
3) The Singapore Straits Times is at the top of the causal network (a root node). This verifies the observation that Singapore is the "canary in the coal mine" and should be monitored diligently.
4) The Dow Jones Transports do not predict the broader market (S&P 500). It's the other way around.
5) U.S. small and mid cap indexes do not predict or cause the broader market (S&P 500).
6) As there is a causal chain from Hong Kong to most of the other stock markets, China may have been the cause of the market swoon in August/September 2015.
7) The causal network starts with Asia, progresses through Europe and then to the Americas, first to the U.S. and then Brazil, Mexico, and Canada. This verifies the observation that money travels around the globe following the sun.
8) Sitting at the bottom of the network is the U.S. NASDAQ Composite (a leaf node). The NASDAQ is an effect, not a cause.
More Technical Stuff
The stock market index data used was the daily closing values from January 4th, 2007 to October 23rd, 2015. This covered the period before the Great Recession through the "recovery". The analysis looked at the change in the daily close of the stock indexes.
The specific bayesian network algorithm used was the Tabu (taboo) search.
By Kyle Atkinson, October 25th, 2015.