Wilshire 5000 Stock Index Forecast
Wilshire 5000 Forecast Values
Stock Price Index Values, Average of Month.
| Month | Date | Forecast Value | Avg Error |
|---|---|---|---|
| 0 | Apr 2026 | 68410.43 | ±0.00 |
| 1 | May 2026 | 71025.0 | ±494.0 |
| 2 | Jun 2026 | 69563.0 | ±643.7 |
| 3 | Jul 2026 | 71345.0 | ±731.3 |
| 4 | Aug 2026 | 72350.0 | ±793.4 |
| 5 | Sep 2026 | 72990.0 | ±841.6 |
| 6 | Oct 2026 | 73900.0 | ±881.0 |
| 7 | Nov 2026 | 75020.0 | ±914.3 |
| 8 | Dec 2026 | 76710.0 | ±943.2 |
Get the Rest of the Story with the 5 Year Forecast!
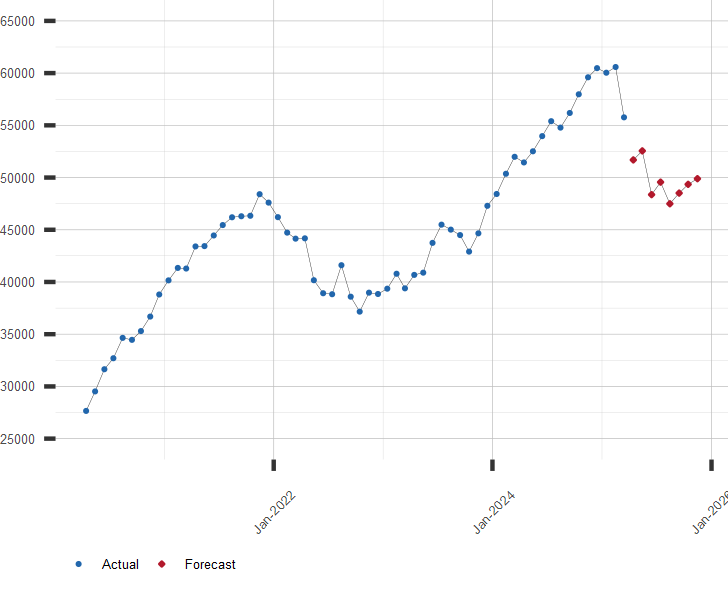
Chart of Wilshire 5000 with Forecast
Stock Price Index Values, Average of Month.
Other Wilshire 5000 and Stock Market Resources:
A long range forecast for the Wilshire 5000 and similar financial series is available by subscription. Click here to subscribe now!
| May 13, 2026 | ||
| Stock Market | Value | Change |
|---|---|---|
| U.S. S&P 500 | 7,444.25 | 0.58% |
| Japan Nikkei 225 | 63,272.11 | 0.84% |
| Hong Kong Hang Seng | 26,388.44 | 0.15% |
| UK FTSE 100 | 10,325.35 | 0.58% |
| German DAX | 24,136.81 | 0.76% |
| Brazil Bovespa | 177,098.30 | -1.80% |