U.S. Producer Price Index PPI Forecast
U.S. Producer Price Index PPI Forecast Values
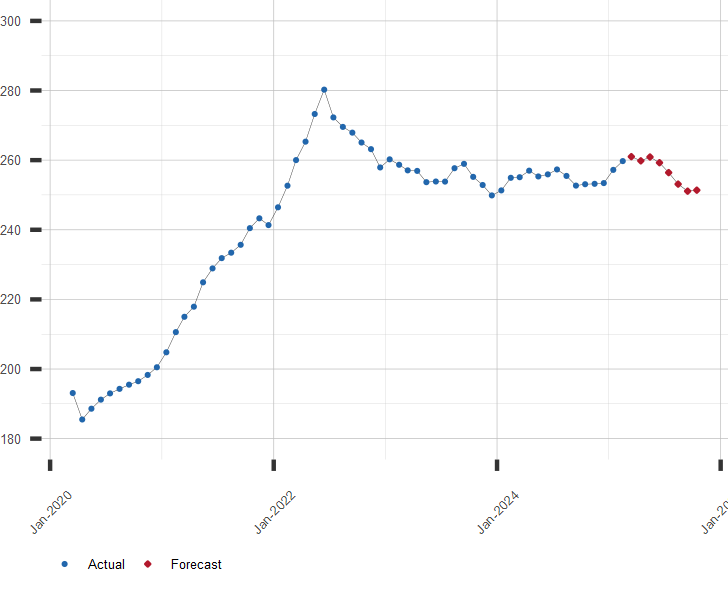
Price Index, All Commodities. 1982 = 100. Not Seasonally Adjusted
| Month | Date | Forecast Value | Avg Error |
|---|---|---|---|
| 0 | May 2026 | 292.5 | ±0.0 |
| 1 | Jun 2026 | 297.2 | ±0.5 |
| 2 | Jul 2026 | 299.5 | ±0.7 |
| 3 | Aug 2026 | 294.4 | ±0.8 |
| 4 | Sep 2026 | 288.3 | ±0.8 |
| 5 | Oct 2026 | 277.3 | ±0.9 |
| 6 | Nov 2026 | 269.6 | ±0.9 |
| 7 | Dec 2026 | 268.1 | ±0.9 |
| 8 | Jan 2027 | 266.4 | ±1.0 |
Get the Rest of the Story with the 5 Year Forecast!
Chart of U.S. Producer Price Index (PPI)
Price Index, All Commodities. 1982=100. Not Seasonally Adjusted.
Other Price Index Resources:
A long range forecast for the PPI and similar economic series is available by subscription. Click here for more information or to subscribe.
| June 29, 2026 | |
| Indicator | Value |
|---|---|
| S&P 500 | 7440.43 |
| U.S. GDP Growth, YoY % | 2.68 |
| U.S. Inflation Rate, % | 4.25 |
| Gold Price, $/oz-t | 4016.96 |
| Crude Oil Futures, $/bbl | 70.42 |
| U.S. 10 Year Treasury, % | 4.38 |