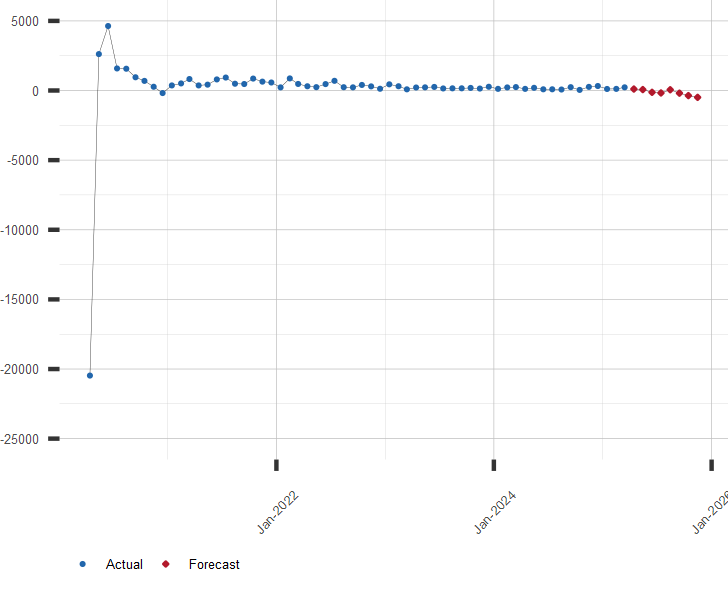
U.S. Nonfarm Payrolls Growth Forecast
Growth in U.S. Nonfarm Payrolls Forecast Values
Month over Month Change in Total Nonfarm Payrolls, Thousand People.
| Month | Date | Forecast Value | Avg Error |
|---|---|---|---|
| 0 | Jun 2026 | 57.0 | ±0.0 |
| 1 | Jul 2026 | 83.0 | ±43.0 |
| 2 | Aug 2026 | 95.0 | ±47.9 |
| 3 | Sep 2026 | 56.0 | ±50.8 |
| 4 | Oct 2026 | -37.0 | ±52.8 |
| 5 | Nov 2026 | 81.0 | ±54.4 |
| 6 | Dec 2026 | 123.0 | ±55.7 |
| 7 | Jan 2027 | 153.0 | ±56.8 |
| 8 | Feb 2027 | 109.0 | ±57.8 |
Get the Rest of the Story with the 5 Year Forecast!
Chart of U.S. Nonfarm Payrolls
Change in Total Nonfarm Payrolls, Month over Month, Thousand People.
Other Employment Resources:
A long range forecast for Non-Farm Payrolls, Jobs Growth and Unemployment Rate is available by subscription. Click here for more information or to subscribe.
| July 16, 2026 | |
| Indicator | Value |
|---|---|
| S&P 500 | 7533.77 |
| U.S. GDP Growth, YoY % | 2.68 |
| U.S. Inflation Rate, % | 3.53 |
| Gold Price, $/oz-t | 3975.20 |
| Crude Oil Futures, $/bbl | 78.95 |
| U.S. 10 Year Treasury, % | 4.57 |