U.S. Hourly Wage Forecast
Below is a forecast of average hourly wages in the U.S. broken down by month. This forecast of hourly wages is based on prior values of hourly wages along with other employment indicators, inflation, and business indicators. Please see our methodology page for a better understanding of how this forecast is created.
Average Hourly Wage Forecast Values
U.S. Average Hourly Wages, Total Private. USD/Hour
| Month | Date | Forecast Value | Avg Error |
|---|---|---|---|
| 0 | Jun 2026 | 32.19 | ±0.00 |
| 1 | Jul 2026 | 32.28 | ±0.023 |
| 2 | Aug 2026 | 32.38 | ±0.028 |
| 3 | Sep 2026 | 32.52 | ±0.031 |
| 4 | Oct 2026 | 32.64 | ±0.033 |
| 5 | Nov 2026 | 32.76 | ±0.034 |
| 6 | Dec 2026 | 32.71 | ±0.036 |
| 7 | Jan 2027 | 32.84 | ±0.037 |
| 8 | Feb 2027 | 32.97 | ±0.038 |
Get the Rest of the Story with the 5 Year Forecast!
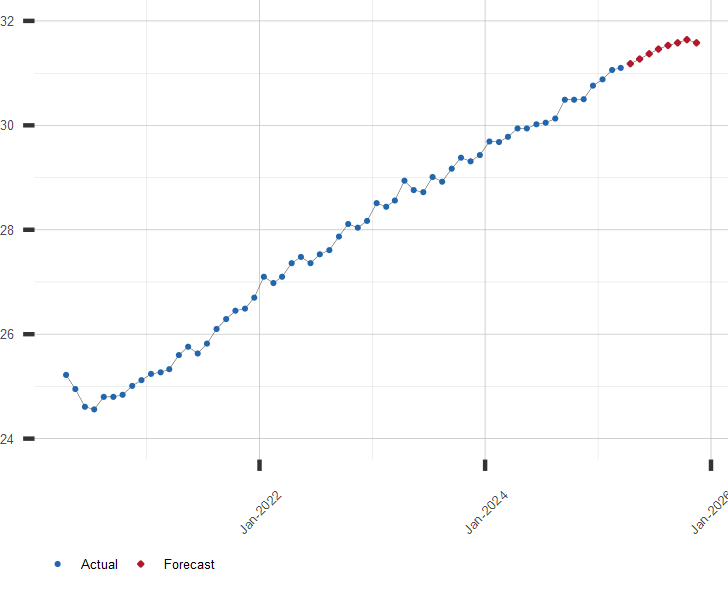
Chart of Hourly Pay with Forecast
Average Wages per hour. USD/Hr.
Other Employment, Pay and Compensation Resources:
A long range forecast for Hourly Pay and similar economic series is available by subscription. Click here for more information or to subscribe.
| July 23, 2026 | |
| Indicator | Value |
|---|---|
| S&P 500 | 7408.30 |
| U.S. GDP Growth, YoY % | 2.68 |
| U.S. Inflation Rate, % | 3.53 |
| Gold Price, $/oz-t | 4048.50 |
| Crude Oil Futures, $/bbl | 91.56 |
| U.S. 10 Year Treasury, % | 4.71 |