U.S. Total Nonfarm Payrolls Forecast
Nonfarm Payroll Forecast Values
Total Nonfarm Payroll Jobs. Thousands of People, Seasonally Adjusted.
| Month | Date | Forecast Value | Avg Error |
|---|---|---|---|
| 0 | Jun 2026 | 158984.0 | ±0.0 |
| 1 | Jul 2026 | 159067.0 | ±41.0 |
| 2 | Aug 2026 | 159162.0 | ±45.9 |
| 3 | Sep 2026 | 159218.0 | ±48.7 |
| 4 | Oct 2026 | 159181.0 | ±50.7 |
| 5 | Nov 2026 | 159262.0 | ±52.3 |
| 6 | Dec 2026 | 159385.0 | ±53.5 |
| 7 | Jan 2027 | 159538.0 | ±54.6 |
| 8 | Feb 2027 | 159647.0 | ±55.6 |
Get the Rest of the Story with the 5 Year Forecast!
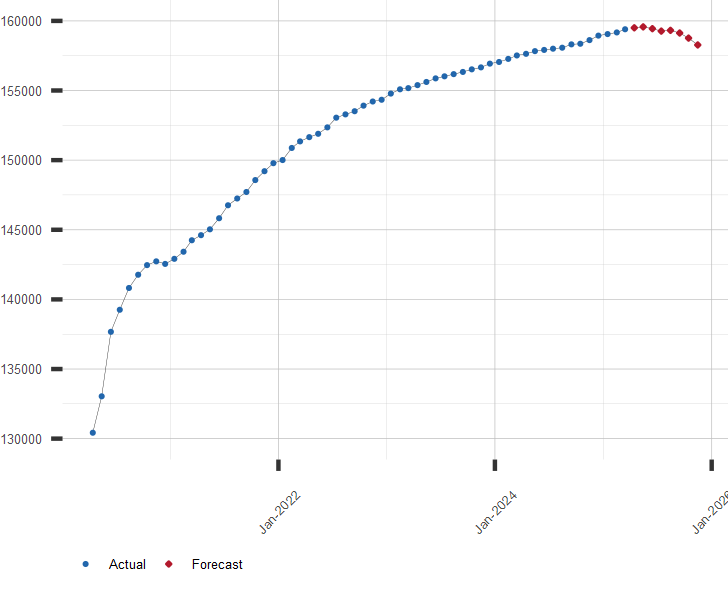
Chart of Total Nonfarm Payroll with Forecast
Nonfarm payroll jobs. Thousand People, Seasonally Adjusted.
Other Employment Links of Interest:
A long range forecast for Nonfarm Payrolls and Unemployment Rate is available by subscription. Click here for more information or to subscribe.
| July 10, 2026 | |
| Indicator | Value |
|---|---|
| S&P 500 | 7575.39 |
| U.S. GDP Growth, YoY % | 2.68 |
| U.S. Inflation Rate, % | 4.25 |
| Gold Price, $/oz-t | 4119.40 |
| Crude Oil Futures, $/bbl | 71.51 |
| U.S. 10 Year Treasury, % | 4.56 |