U.S. GDP Deflator Forecast
U.S. GDP Implicit Price Deflator Forecast Values
U.S. Implicit Price Deflator, index 2009-100, Seasonally Adjusted.
| Month | Date | Forecast Value | Avg Error |
|---|---|---|---|
| 0 | Mar 2026 | 131.783 | ±0.000 |
| 1 | Apr 2026 | 132.91 | ±0.05 |
| 2 | May 2026 | 132.91 | ±0.05 |
| 3 | Jun 2026 | 132.91 | ±0.05 |
| 4 | Jul 2026 | 133.72 | ±0.064 |
| 5 | Aug 2026 | 133.72 | ±0.064 |
| 6 | Sep 2026 | 133.72 | ±0.064 |
| 7 | Oct 2026 | 134.43 | ±0.069 |
| 8 | Nov 2026 | 134.43 | ±0.069 |
Get the Rest of the Story with the 5 Year Forecast!
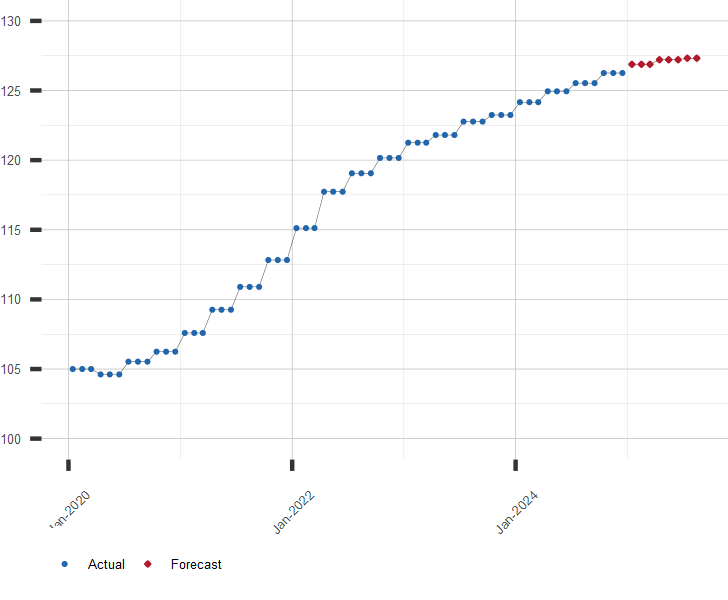
Trend Chart of U.S. GDP Implicit Price Deflator
GDP Price Deflator, index 2009=100, seasonally adjusted.
Other GDP and Inflation Resources:
A long range forecast for this or similar economic series is available by subscription. Click here for more information or to subscribe now
| July 17, 2026 | |
| Indicator | Value |
|---|---|
| S&P 500 | 7457.69 |
| U.S. GDP Growth, YoY % | 2.68 |
| U.S. Inflation Rate, % | 3.53 |
| Gold Price, $/oz-t | 3995.35 |
| Crude Oil Futures, $/bbl | 81.78 |
| U.S. 10 Year Treasury, % | 4.55 |