Forecast of S&P 100 Stock Index
S&P 100 Stock Index Forecast Values
Stock Price Index Values, Average of Month.
| Month | Date | Forecast Value | Avg Error |
|---|---|---|---|
| 0 | Jun 2026 | 3668.27 | ±0.00 |
| 1 | Jul 2026 | 3707.0 | ±21.0 |
| 2 | Aug 2026 | 3752.0 | ±27.4 |
| 3 | Sep 2026 | 3801.0 | ±31.1 |
| 4 | Oct 2026 | 3745.0 | ±33.8 |
| 5 | Nov 2026 | 3827.0 | ±35.8 |
| 6 | Dec 2026 | 3896.0 | ±37.5 |
| 7 | Jan 2027 | 3947.0 | ±38.9 |
| 8 | Feb 2027 | 4007.0 | ±40.1 |
Get the Rest of the Story with the 5 Year Forecast!
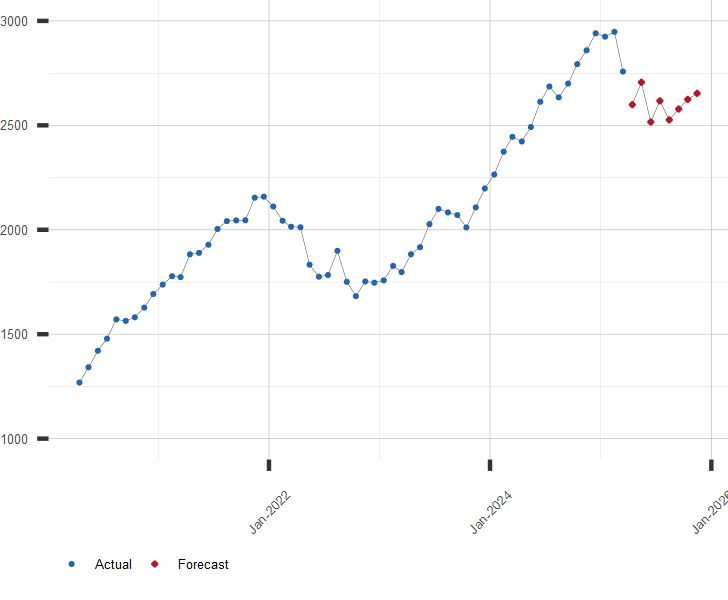
Chart of S&P 100 Stock Index with Forecast
Stock Price Index Values, Average of Month.
Other Stock Market Resources:
A long range forecast for the S&P 100 and similar financial series is available by subscription. Click here to subscribe now
| July 30, 2026 | ||
| Stock Market | Value | Change |
|---|---|---|
| U.S. S&P 500 | 7,437.63 | 1.66% |
| Japan Nikkei 225 | 61,867.43 | 0.71% |
| Hong Kong Hang Seng | 25,858.88 | 0.20% |
| UK FTSE 100 | 10,897.27 | -0.10% |
| German DAX | 25,612.03 | 0.60% |
| Brazil Bovespa | 176,939.62 | 1.76% |