Forecast of S&P MidCap 400
S&P MidCap 400 Forecast Values
Stock Price Index Values, Average of Month.
| Month | Date | Forecast Value | Avg Error |
|---|---|---|---|
| 0 | Feb 2026 | 3553.47 | ±0.00 |
| 1 | Mar 2026 | 3295.0 | ±41.0 |
| 2 | Apr 2026 | 3369.0 | ±45.0 |
| 3 | May 2026 | 3418.0 | ±47.4 |
| 4 | Jun 2026 | 3453.0 | ±49.0 |
| 5 | Jul 2026 | 3430.0 | ±50.3 |
| 6 | Aug 2026 | 3480.0 | ±51.4 |
| 7 | Sep 2026 | 3539.0 | ±52.3 |
| 8 | Oct 2026 | 3595.0 | ±53.1 |
Get the Rest of the Story with the 5 Year Forecast!
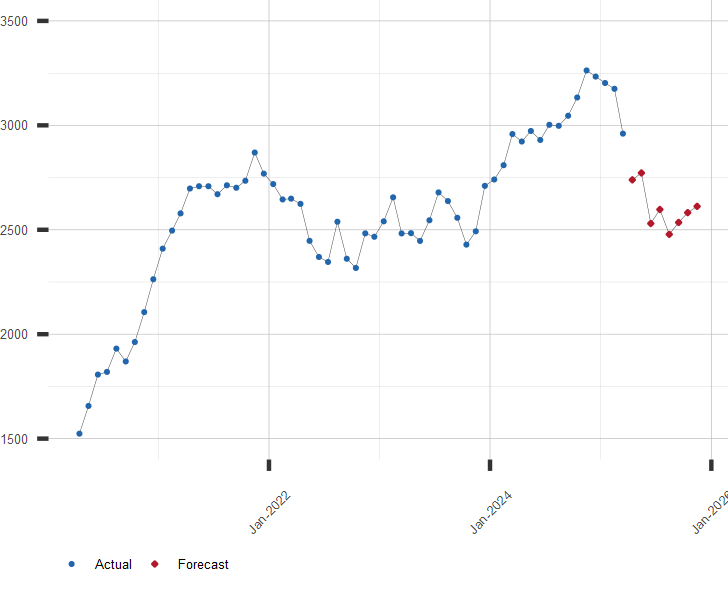
Chart of S&P MidCap 400 with Forecast
Stock Price Index Values. Average of Month
Other Stock Market Forecasts Resources:
A long range forecast for the S&P Midcap 400 and similar financial series is available by subscription. Click here for more information or to subscribe now
| March 13, 2026 | ||
| Stock Market | Value | Change |
|---|---|---|
| U.S. S&P 500 | 6,632.19 | 0.61% |
| Japan Nikkei 225 | 53,819.61 | -1.16% |
| Hong Kong Hang Seng | 25,465.60 | -0.98% |
| UK FTSE 100 | 10,261.15 | -0.43% |
| German DAX | 23,447.29 | -0.60% |
| Brazil Bovespa | 177,653.31 | -0.91% |