Forecast of Total U.S. Bank Credit
Below is a forecast of the total bank credit outstanding at all commercial banks in the U.S. The forecast is broken down by month. This forecast is produced based on prior values of U.S. bank credit along with other factors such as interest rates, employment, income and various other economic indicators. To learn more about how this forecast is produced, please see our methodology page.
U.S. Total Bank Credit Forecast Values
Total Bank Credit Outstanding at All U.S. Commercial Banks. Billion USD, NSA.
| Month | Date | Forecast Value | Avg Error |
|---|---|---|---|
| 0 | Feb 2026 | 19206.78 | ±0.00 |
| 1 | Mar 2026 | 19291.0 | ±37.0 |
| 2 | Apr 2026 | 19425.0 | ±42.1 |
| 3 | May 2026 | 19524.0 | ±45.1 |
| 4 | Jun 2026 | 19634.0 | ±47.3 |
| 5 | Jul 2026 | 19727.0 | ±48.9 |
| 6 | Aug 2026 | 19857.0 | ±50.3 |
| 7 | Sep 2026 | 19979.0 | ±51.4 |
| 8 | Oct 2026 | 20003.0 | ±52.4 |
Get the Rest of the Story with the 5 Year Forecast!
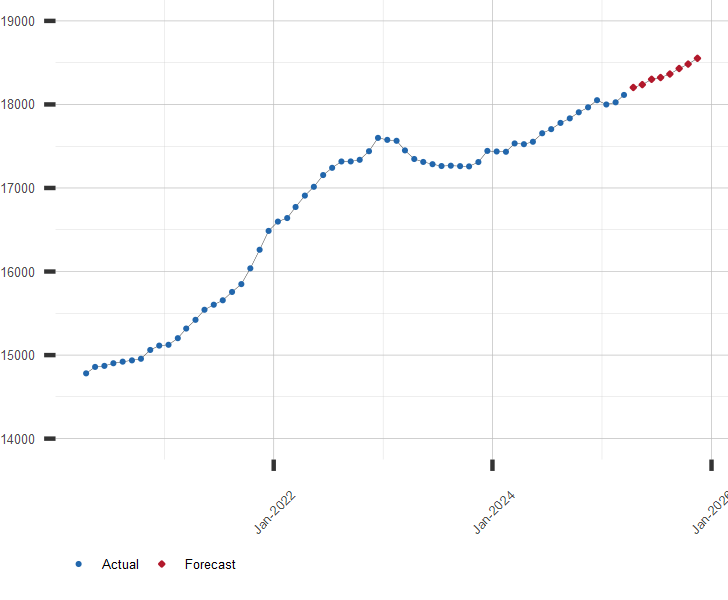
Chart of Total Bank Credit with Forecast
Billion U.S. Dollars, Not Seasonally Adjusted
Other Banking and Credit Resources of Interest:
A long range forecast for U.S. Total Bank Loans and similar economic series is available by subscription. Click here for more information or to subscribe.
| April 01, 2026 | |
| Indicator | Value |
|---|---|
| S&P 500 | 6575.32 |
| U.S. GDP Growth, YoY % | 2.03 |
| U.S. Inflation Rate, % | 2.41 |
| Gold Price, $/oz-t | 4739.00 |
| Crude Oil Futures, $/bbl | 101.90 |
| U.S. 10 Year Treasury, % | 4.33 |