Commodity Price Index Forecast (Non-energy)
World Bank Commodity Price Index Forecast Values
Non-Energy Commodity Price Index Values, Average of Month. 2010=100.
| Month | Date | Forecast Value | Avg Error |
|---|---|---|---|
| 0 | May 2026 | 129.45 | ±0.00 |
| 1 | Jun 2026 | 129.88 | ±0.38 |
| 2 | Jul 2026 | 129.05 | ±0.48 |
| 3 | Aug 2026 | 129.39 | ±0.54 |
| 4 | Sep 2026 | 128.14 | ±0.59 |
| 5 | Oct 2026 | 126.48 | ±0.62 |
| 6 | Nov 2026 | 125.10 | ±0.65 |
| 7 | Dec 2026 | 124.19 | ±0.67 |
| 8 | Jan 2027 | 124.64 | ±0.69 |
Get the Rest of the Story with the 5 Year Forecast!
Chart of Commodity Price Index
World Bank Non-Energy Commodity Price Index. 2010=100
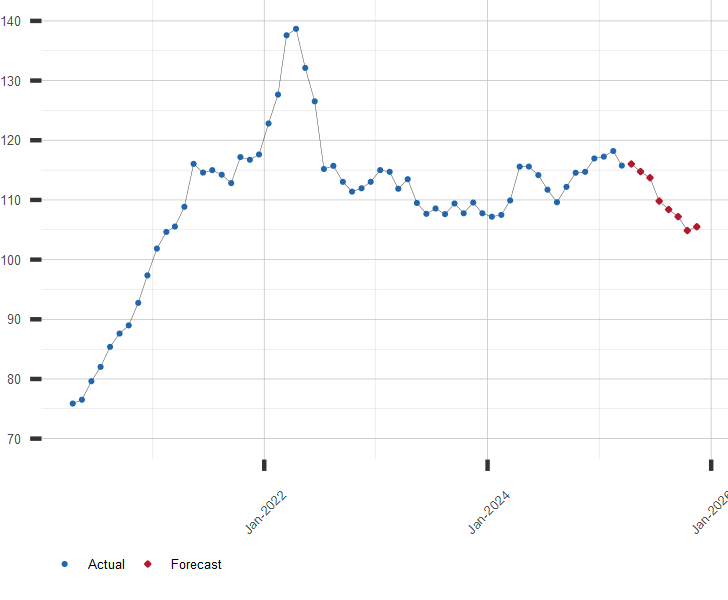
World Bank Non-Energy Commodity Price Index
The series above is the World Bank's commodity price index for non-energy items. These items include agriculture, food, raw materials, fertilizers and base metals. The index is based on commodity prices that are global in nature.
Other Commodity Price Resources:
A long range forecast for Commodity Price Index and similar financial series is available by subscription. Click here for more information or to subscribe.
| July 06, 2026 | |
| Indicator | Value |
|---|---|
| S&P 500 | 7537.43 |
| U.S. GDP Growth, YoY % | 2.68 |
| U.S. Inflation Rate, % | 4.25 |
| Gold Price, $/oz-t | 4164.00 |
| Crude Oil Futures, $/bbl | 68.62 |
| U.S. 10 Year Treasury, % | 4.48 |