Forecast of U.S. Hourly Pay
Hourly Pay Forecast Values
Compensation per hour, total private. $/Hour.
| Month | Date | Forecast Value | Avg Error |
|---|---|---|---|
| 0 | Jun 2026 | 32.19 | ±0.00 |
| 1 | Jul 2026 | 32.28 | ±0.023 |
| 2 | Aug 2026 | 32.38 | ±0.028 |
| 3 | Sep 2026 | 32.52 | ±0.031 |
| 4 | Oct 2026 | 32.64 | ±0.033 |
| 5 | Nov 2026 | 32.76 | ±0.034 |
| 6 | Dec 2026 | 32.71 | ±0.036 |
| 7 | Jan 2027 | 32.84 | ±0.037 |
| 8 | Feb 2027 | 32.97 | ±0.038 |
Get the Rest of the Story with the 5 Year Forecast!
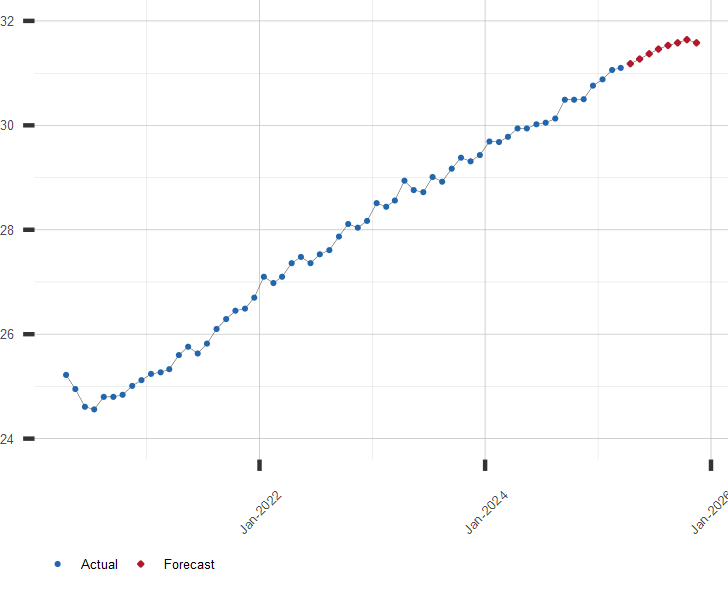
Chart of U.S. Average Hourly Pay
Pay Per Hour. $/Hour.
Other Employment and Job Pay Resources:
A long range forecast for Hourly Pay and similar economic series is available by subscription. Click here for more information or to subscribe.
| July 27, 2026 | |
| Indicator | Value |
|---|---|
| S&P 500 | 7413.18 |
| U.S. GDP Growth, YoY % | 2.68 |
| U.S. Inflation Rate, % | 3.53 |
| Gold Price, $/oz-t | 4080.50 |
| Crude Oil Futures, $/bbl | 81.87 |
| U.S. 10 Year Treasury, % | 4.65 |