PCE Core Inflation Forecast
PCE Core Price Index Inflation Rate Forecast Values
Year over Year Percent Change in Core PCE Price Index.
| Month | Date | Forecast Value | Avg Error |
|---|---|---|---|
| 0 | May 2026 | 3.41 | ±0.00 |
| 1 | Jun 2026 | 3.37 | ±0.051 |
| 2 | Jul 2026 | 3.29 | ±0.053 |
| 3 | Aug 2026 | 3.18 | ±0.054 |
| 4 | Sep 2026 | 3.07 | ±0.055 |
| 5 | Oct 2026 | 2.98 | ±0.056 |
| 6 | Nov 2026 | 2.87 | ±0.056 |
| 7 | Dec 2026 | 2.66 | ±0.057 |
| 8 | Jan 2027 | 2.43 | ±0.057 |
Get the Rest of the Story with the 5 Year Forecast!
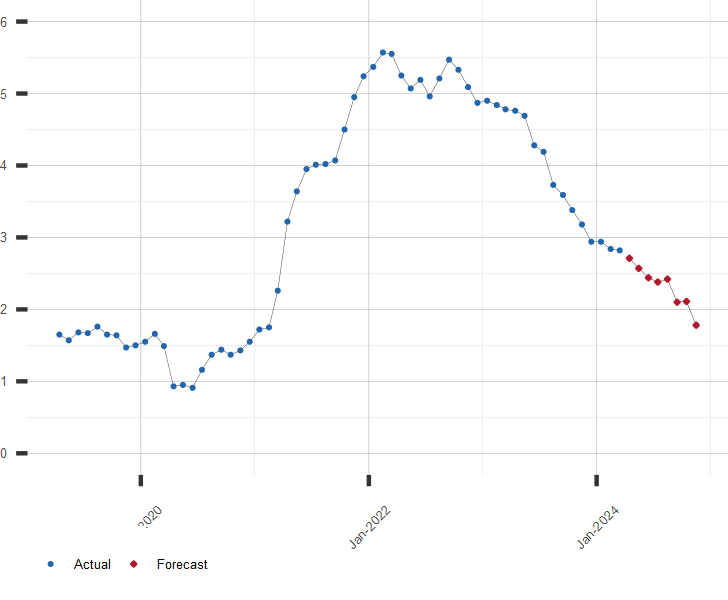
Chart of PCE Core Inflation Rate
Year over Year Percent Change in Core PCE Price Index.
Other Price and Price Index Resources:
A long range forecast for U.S. PCE Price Index and Core Inflation Rate is available by subscription. Click here for more information or to subscribe to PCE PI and Inflation Extended Forecasts.
| July 16, 2026 | |
| Indicator | Value |
|---|---|
| S&P 500 | 7533.77 |
| U.S. GDP Growth, YoY % | 2.68 |
| U.S. Inflation Rate, % | 3.53 |
| Gold Price, $/oz-t | 3975.20 |
| Crude Oil Futures, $/bbl | 78.95 |
| U.S. 10 Year Treasury, % | 4.57 |