Dow Jones Utility Average Forecast
Dow Jones Utilities Forecast Values.
Stock Price Index Values, Average of Month.
| Month | Date | Forecast Value | Avg Error |
|---|---|---|---|
| 0 | May 2025 | 1032.12 | ±0.00 |
| 1 | Jun 2025 | 1028.0 | ±13.0 |
| 2 | Jul 2025 | 1022.0 | ±14.5 |
| 3 | Aug 2025 | 1008.0 | ±15.3 |
| 4 | Sep 2025 | 1036.0 | ±15.9 |
| 5 | Oct 2025 | 1044.0 | ±16.4 |
| 6 | Nov 2025 | 1048.0 | ±16.8 |
| 7 | Dec 2025 | 1061.0 | ±17.1 |
| 8 | Jan 2026 | 1069.0 | ±17.4 |
Get the Rest of the Story with the 5 Year Forecast!
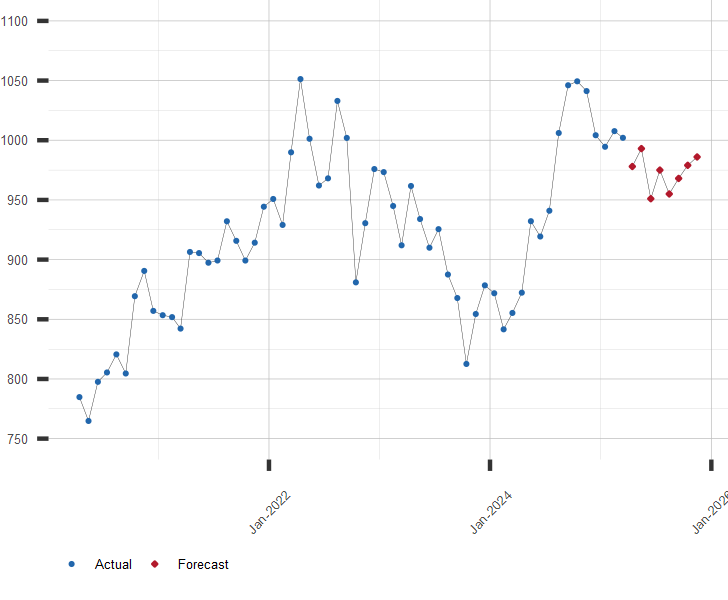
Chart of the DJU with Forecast
Stock Price Index Values, Average of Month.
Other Stock Market Resources:
A long range forecast for the DJU and similar financial series is available by subscription. Click here for more information or to subscribe now
| June 25, 2025 | ||
| Stock Market | Value | Change |
|---|---|---|
| U.S. S&P 500 | 6,092.16 | 0.00% |
| Japan Nikkei 225 | 38,942.07 | 0.39% |
| Hong Kong Hang Seng | 24,474.67 | 1.23% |
| UK FTSE 100 | 8,718.75 | -0.46% |
| German DAX | 23,498.33 | -0.61% |
| Brazil Bovespa | 135,767.30 | -1.02% |