U.S. Currency in Circulation Forecast
U.S. Currency in Circulation Forecast Values
Billion US Dollars in Circulation.
| Month | Date | Forecast Value | Avg Error |
|---|---|---|---|
| 0 | Apr 2026 | 2451.59 | ±0.00 |
| 1 | May 2026 | 2461.2 | ±3.9 |
| 2 | Jun 2026 | 2471.5 | ±4.7 |
| 3 | Jul 2026 | 2482.9 | ±5.1 |
| 4 | Aug 2026 | 2496.4 | ±5.5 |
| 5 | Sep 2026 | 2506.9 | ±5.7 |
| 6 | Oct 2026 | 2522.0 | ±5.9 |
| 7 | Nov 2026 | 2536.4 | ±6.1 |
| 8 | Dec 2026 | 2547.8 | ±6.2 |
Get the Rest of the Story with the 5 Year Forecast!
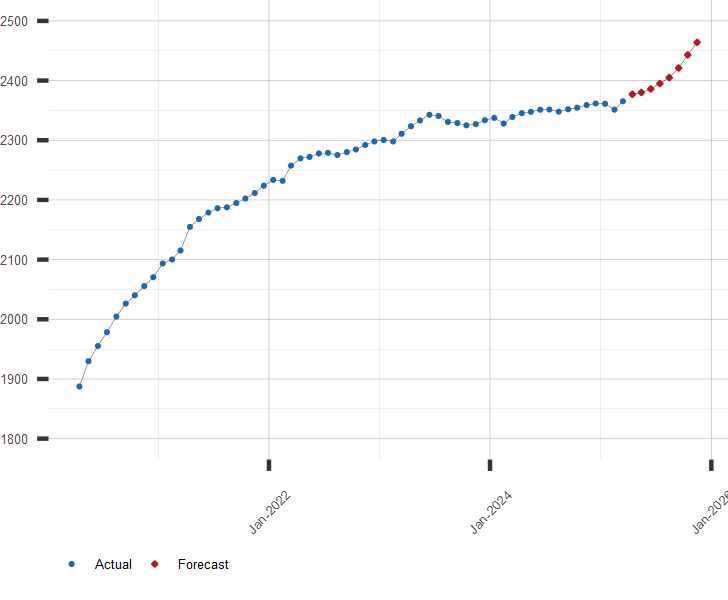
Chart of U.S. Currency in Circulation with Forecast
Billion U.S. Dollars Floating Around.
Other Money Supply Resources:
Long range forecasts for Currency in Circulation and Money Supply series are available by subscription. Click here for more information or to subscribe.
| May 15, 2026 | |
| Indicator | Value |
|---|---|
| S&P 500 | 7408.50 |
| U.S. GDP Growth, YoY % | 2.66 |
| U.S. Inflation Rate, % | 3.81 |
| Gold Price, $/oz-t | 4528.00 |
| Crude Oil Futures, $/bbl | 105.66 |
| U.S. 10 Year Treasury, % | 4.59 |