Forecast of Dow Jones Transports, DJT
DJT Stock Index Forecast Values
Stock Price Index Values, Average of Month.
| Month | Date | Forecast Value | Avg Error |
|---|---|---|---|
| 0 | Jan 2026 | 18098.90 | ±0.00 |
| 1 | Feb 2026 | 18677.0 | ±241.0 |
| 2 | Mar 2026 | 18562.0 | ±284.0 |
| 3 | Apr 2026 | 18344.0 | ±309.1 |
| 4 | May 2026 | 18754.0 | ±327.0 |
| 5 | Jun 2026 | 18393.0 | ±340.8 |
| 6 | Jul 2026 | 17916.0 | ±352.1 |
| 7 | Aug 2026 | 18028.0 | ±361.6 |
| 8 | Sep 2026 | 18361.0 | ±369.9 |
Get the Rest of the Story with the 5 Year Forecast!
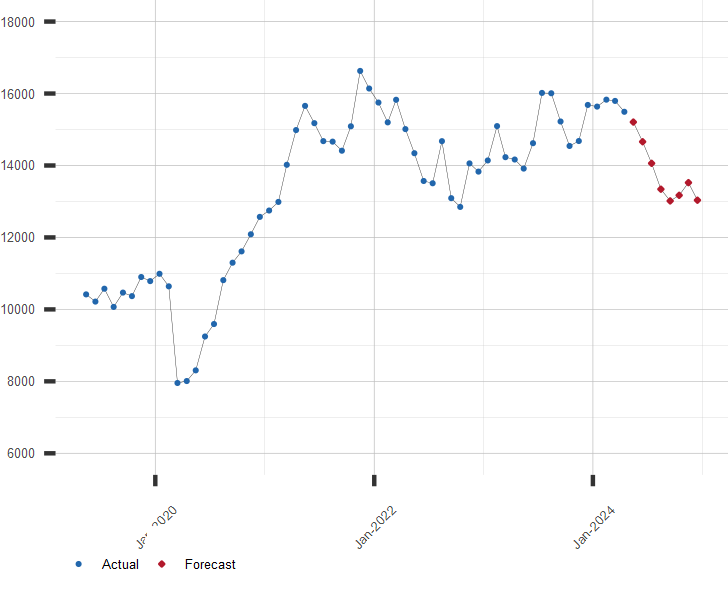
Chart of Dow Jones Transports with Forecast
DJ Transportation Average. Average of Month.
Other Dow Jones Transportation Average Links of Interest:
A long range forecast for the Dow Jones Transportation Average and similar financial series is available by subscription. Click here to subscribe to the DJ Transports Extended Forecast.
| February 12, 2026 | ||
| Stock Market | Value | Change |
|---|---|---|
| U.S. S&P 500 | 6,832.76 | -1.57% |
| Japan Nikkei 225 | 57,639.84 | -0.02% |
| Hong Kong Hang Seng | 27,032.54 | -0.86% |
| UK FTSE 100 | 10,402.44 | -0.67% |
| German DAX | 24,852.69 | -0.01% |
| Brazil Bovespa | 187,766.42 | -1.02% |