Fed Funds Rate Forecast
Below is a detailed forecast of the Fund Funds interest rate by month.
This forecast is produced based on prior values of the fed funds rate along with other factors such as inflation, U.S. employment, and the U.S. housing market.
Fed Funds Rate Forecast Values
Interest Rate. Percent, Average of Month.
| Month | Date | Forecast Value | Avg Error |
|---|---|---|---|
| 0 | Aug 2026 | 3.63 | ±0.00 |
| 1 | Sep 2026 | 3.75 | ±0.08 |
| 2 | Oct 2026 | 3.75 | ±0.095 |
| 3 | Nov 2026 | 3.88 | ±0.10 |
| 4 | Dec 2026 | 3.88 | ±0.11 |
| 5 | Jan 2027 | 4.06 | ±0.11 |
| 6 | Feb 2027 | 4.13 | ±0.12 |
| 7 | Mar 2027 | 4.13 | ±0.12 |
| 8 | Apr 2027 | 4.13 | ±0.12 |
Download Historical and Forecast Data
Explore the Longer-Term Outlook with Our 5 Year Forecast
Chart of Fed Funds Rate
U.S. FRB Fed Funds Rate, Percent Per Year. Includes Current Prediction.
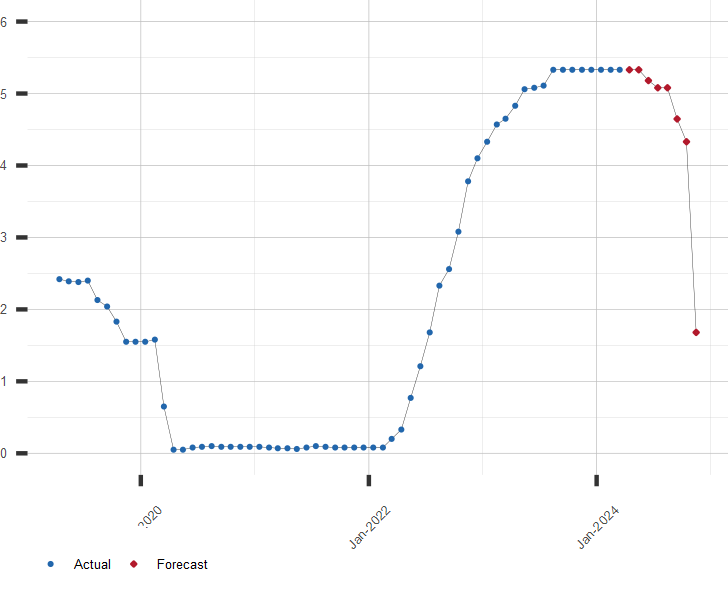
The U.S. Fed Funds Rate
The U. S. Federal Funds Rate is the interest rate a U.S. Federal Reserve depository institution (bank, S&L or Credit Union) will charge another bank to borrow their excess reserves held at the Federal Reserve. These reserves, or Federal Funds, are traded by banks (usually overnight) to meet their reserve requirements or enable the clearing of financial transactions.
Other Interest Rate Resources of Interest:
A long range forecast for the Fed Funds Rate, Prime Rate, and similar economic series is available by subscription. Click here for more information or to subscribe now!
| September 17, 2026 | |
| Indicator | Rate, % |
|---|---|
| Prime Rate | 6.75 |
| 30 Year Treasury Bond | 5.29 |
| 10 Year Treasury Note | 4.94 |
| 91 Day Treasury Bill | 4.12 |
| Fed Funds | 3.88 |
| SOFR | 3.87 |
| 30 Year Mortgage Rate | 6.95 |