NASDAQ Composite Index Forecast
NASDAQ Composite Forecast Values
Stock Price Index Values, Average of Month.
| Month | Date | Forecast Value | Avg Error |
|---|---|---|---|
| 0 | May 2026 | 26107.93 | ±0.00 |
| 1 | Jun 2026 | 26782.0 | ±123.0 |
| 2 | Jul 2026 | 27165.0 | ±148.6 |
| 3 | Aug 2026 | 27583.0 | ±163.6 |
| 4 | Sep 2026 | 27900.0 | ±174.3 |
| 5 | Oct 2026 | 27350.0 | ±182.5 |
| 6 | Nov 2026 | 28010.0 | ±189.3 |
| 7 | Dec 2026 | 28870.0 | ±195.0 |
| 8 | Jan 2027 | 29350.0 | ±199.9 |
Get the Rest of the Story with the 5 Year Forecast!
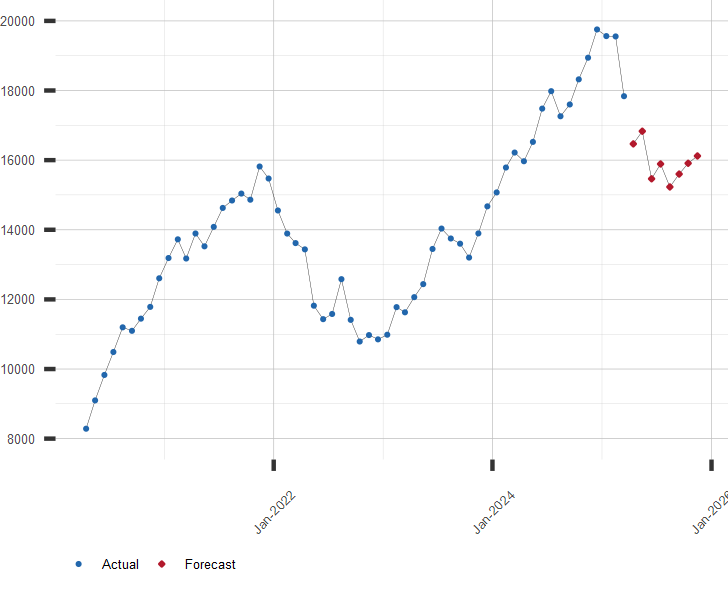
Chart of NASDAQ Composite Index
NASDAQ Composite, Average of Month. Includes Current Prediction.
Other NASDAQ Stock Index Resources:
A long range forecast for the NASDAQ Composite and similar financial series is available by subscription
Click here to subscribe to the NASDAQ Composite Extended Forecast.| June 16, 2026 | ||
| Stock Market | Value | Change |
|---|---|---|
| U.S. S&P 500 | 7,511.35 | -0.57% |
| Japan Nikkei 225 | 69,404.50 | 0.13% |
| Hong Kong Hang Seng | 24,493.95 | -1.40% |
| UK FTSE 100 | 10,494.21 | 0.61% |
| German DAX | 24,910.41 | 0.07% |
| Brazil Bovespa | 169,648.47 | -0.45% |