Forecast of FTSE 100 Stock Index
FTSE 100 Forecast Values
Stock Price Index Values, Average of Month.
| Month | Date | Forecast Value | Avg Error |
|---|---|---|---|
| 0 | Jun 2026 | 10402.97 | ±0.00 |
| 1 | Jul 2026 | 10472.0 | ±136.0 |
| 2 | Aug 2026 | 10605.0 | ±146.4 |
| 3 | Sep 2026 | 10720.0 | ±152.5 |
| 4 | Oct 2026 | 10570.0 | ±156.8 |
| 5 | Nov 2026 | 10790.0 | ±160.1 |
| 6 | Dec 2026 | 11010.0 | ±162.9 |
| 7 | Jan 2027 | 11120.0 | ±165.2 |
| 8 | Feb 2027 | 11250.0 | ±167.2 |
Get the Rest of the Story with the 5 Year Forecast!
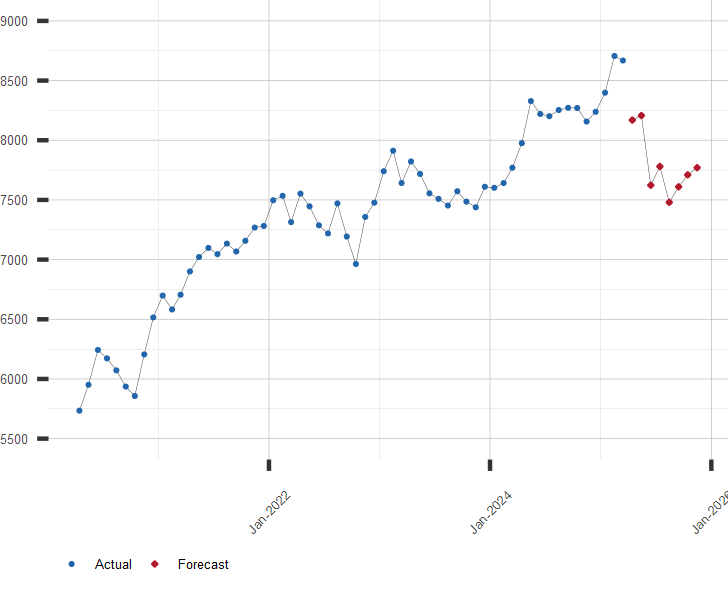
Chart of FTSE 100 Stock Index with Forecast
Index values, average of month
Other Stock Market Resources:
A long range forecast for the FTSE 100 and similar financial series is available by subscription. Click here to subscribe to the FTSE 100 extended forecast.
| July 13, 2026 | ||
| Stock Market | Value | Change |
|---|---|---|
| U.S. S&P 500 | 7,515.34 | -0.79% |
| Japan Nikkei 225 | 67,242.73 | -1.92% |
| Hong Kong Hang Seng | 24,213.72 | 0.16% |
| UK FTSE 100 | 10,498.29 | 0.01% |
| German DAX | 25,114.25 | 0.19% |
| Brazil Bovespa | 175,739.08 | -1.20% |