U.S. Dollar Index DXY Forecast
Below is a forecast of the U.S. dollar index, or DXY, broken down by month. This forecast is based on prior values of currency exchange rates along with various other factors such as commodity prices, interest rates and economic indicators. Please see our methodology page for a better understanding of how this forecast is created.
U.S. Dollar Index DXY Values
Dollar Index, Average of Month.
| Month | Date | Forecast Value | Avg Error |
|---|---|---|---|
| 0 | Apr 2026 | 98.825 | ±0.000 |
| 1 | May 2026 | 98.32 | ±0.38 |
| 2 | Jun 2026 | 99.06 | ±0.46 |
| 3 | Jul 2026 | 100.11 | ±0.50 |
| 4 | Aug 2026 | 100.63 | ±0.53 |
| 5 | Sep 2026 | 102.60 | ±0.56 |
| 6 | Oct 2026 | 103.74 | ±0.58 |
| 7 | Nov 2026 | 104.65 | ±0.59 |
| 8 | Dec 2026 | 103.49 | ±0.61 |
Get the Rest of the Story with the 5 Year Forecast!
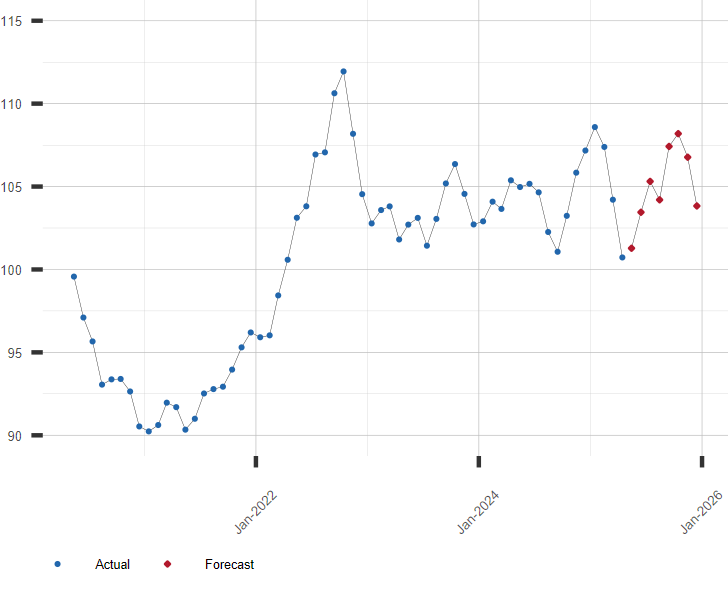
Graph of U.S Dollar Index
U.S. Dollar Index, DXY, with Current Prediction.
Other Exchange Rate Links of Interest:
A long range forecast for the U.S. Dollar Index and similar economic series is available by subscription. Click here to subscribe to the U.S. Dollar Index Extended Forecast.
| May 14, 2026 | |
| Currency | Exchange Rate |
|---|---|
| Japanese Yen to Dollar | 158.38 |
| Euro to Dollar | 1.167 |
| U.K. Pound to Dollar | 1.340 |
| Australian Dollar to USD | 0.722 |
| Indian Rupee to USD | 95.73 |
| Canadian Dollar to USD | 1.372 |
| Mexican Peso to USD | 17.23 |