Forecast of U.S. M1 Money Stock Forecast
M1 Money Supply Forecast Values
Billions US Dollars. Not Seasonally Adjusted.
| Month | Date | Forecast Value | Avg Error |
|---|---|---|---|
| 0 | May 2026 | 19679.8 | ±0.0 |
| 1 | Jun 2026 | 19767.0 | ±17.0 |
| 2 | Jul 2026 | 19811.0 | ±19.8 |
| 3 | Aug 2026 | 19884.0 | ±21.5 |
| 4 | Sep 2026 | 19973.0 | ±22.7 |
| 5 | Oct 2026 | 20040.0 | ±23.6 |
| 6 | Nov 2026 | 20154.0 | ±24.3 |
| 7 | Dec 2026 | 20344.0 | ±25.0 |
| 8 | Jan 2027 | 20316.0 | ±25.5 |
Get the Rest of the Story with the 5 Year Forecast!
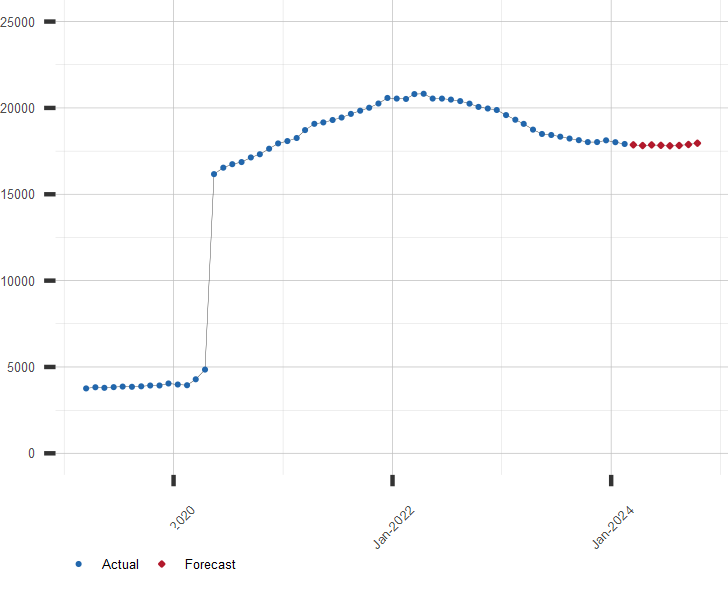
Chart of U.S. M1 Money Supply with Forecast
Billion USD. Not Seasonally Adjusted
Other Money Supply Resources:
A long range forecast for the M1 and M2 money supplies is available by subscription. Click here for more information or to subscribe.
| July 10, 2026 | |
| Indicator | Value |
|---|---|
| S&P 500 | 7575.39 |
| U.S. GDP Growth, YoY % | 2.68 |
| U.S. Inflation Rate, % | 4.25 |
| Gold Price, $/oz-t | 4119.40 |
| Crude Oil Futures, $/bbl | 71.51 |
| U.S. 10 Year Treasury, % | 4.56 |