U.S. GDP Growth Rate Forecast
U.S. Nominal GDP Growth Rate Forecast Values
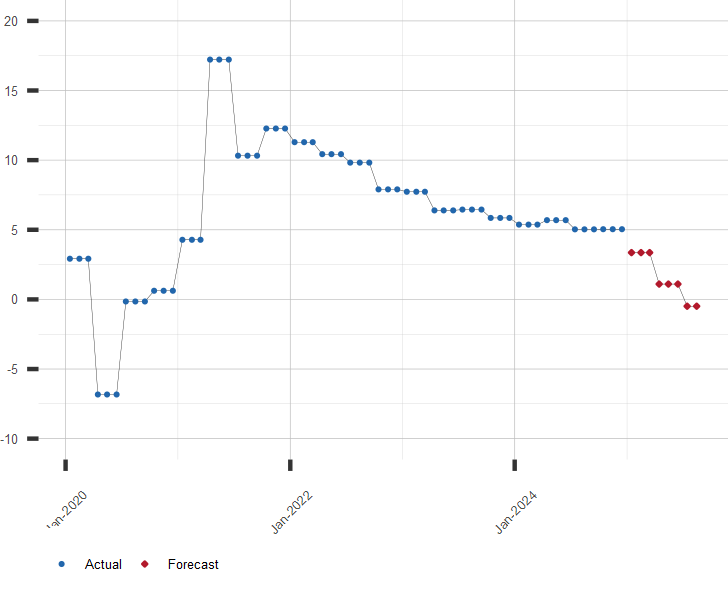
Year over Year Change in Nominal U.S. GDP. Percent per year.
| Month | Date | Forecast Value | Avg Error |
|---|---|---|---|
| 0 | Mar 2026 | 5.92 | ±0.00 |
| 1 | Apr 2026 | 5.96 | ±0.14 |
| 2 | May 2026 | 5.96 | ±0.14 |
| 3 | Jun 2026 | 5.96 | ±0.14 |
| 4 | Jul 2026 | 5.34 | ±0.25 |
| 5 | Aug 2026 | 5.34 | ±0.25 |
| 6 | Sep 2026 | 5.34 | ±0.25 |
| 7 | Oct 2026 | 5.40 | ±0.30 |
| 8 | Nov 2026 | 5.40 | ±0.30 |
Get the Rest of the Story with the 5 Year Forecast!
Chart of U.S. Nominal GDP Growth Rate
Year over Year Percent Change in U.S. Nominal GDP.
Other Gross Domestic Product Resources:
A long range forecast of the US GDP Growth Rate and similar economic series is available by subscription. Click here to subscribe to the GDP Growth extended forecast.
| June 19, 2026 | |
| Indicator | Value |
|---|---|
| S&P 500 | 7500.58 |
| U.S. GDP Growth, YoY % | 2.57 |
| U.S. Inflation Rate, % | 4.25 |
| Gold Price, $/oz-t | 4154.70 |
| Crude Oil Futures, $/bbl | 76.54 |
| U.S. 10 Year Treasury, % | 4.46 |