U.S. House Price Forecast
U.S. House Price Index Forecast Values
Index. 1Q1980=100, NSA.
| Month | Date | Forecast Value | Avg Error |
|---|---|---|---|
| 0 | Mar 2026 | 713.09 | ±0.00 |
| 1 | Apr 2026 | 720.5 | ±0.6 |
| 2 | May 2026 | 720.5 | ±0.7 |
| 3 | Jun 2026 | 720.5 | ±0.8 |
| 4 | Jul 2026 | 725.4 | ±0.9 |
| 5 | Aug 2026 | 725.4 | ±1.0 |
| 6 | Sep 2026 | 725.4 | ±1.0 |
| 7 | Oct 2026 | 733.5 | ±1.0 |
| 8 | Nov 2026 | 733.5 | ±1.1 |
Get the Rest of the Story with the 5 Year Forecast!
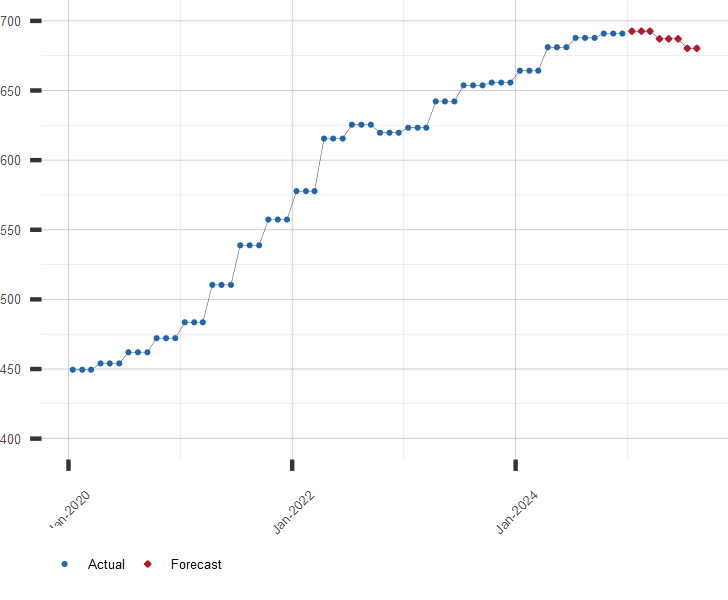
Chart of U.S. House Prices
Index. 1Q1980 = 100, NSA.
Other Housing Resources of Interest:
A long range forecast for U.S. House Prices and similar economic series is available by subscription. Click here to subscribe to the U.S. Average House Price extended forecast.
| June 16, 2026 | |
| Indicator | Value |
|---|---|
| S&P 500 | 7511.35 |
| U.S. GDP Growth, YoY % | 2.57 |
| U.S. Inflation Rate, % | 4.25 |
| Gold Price, $/oz-t | 4331.28 |
| Crude Oil Futures, $/bbl | 76.05 |
| U.S. 10 Year Treasury, % | 4.43 |