U.S. Nonresidential Fixed Investment Forecast
Below is a forecast of the U.S. nonresidential fixed investment, broken down by quarter. This forecast is produced based on prior values of non-residential fixed investment along with other factors such as commodity prices, industrial production, interest rates, and currency exchange rates. To learn more about how this forecast is produced, please see our methodology page.
Nonresidential Fixed Investment Forecast Values
Billion US Dollars. Annual Rate, Seasonally Adjusted.
| Month | Date | Forecast Value | Avg Error |
|---|---|---|---|
| 0 | Mar 2026 | 4494.45 | ±0.00 |
| 1 | Apr 2026 | 4579.3 | ± 9.6 |
| 2 | May 2026 | 4579.3 | ± 9.6 |
| 3 | Jun 2026 | 4579.3 | ± 9.6 |
| 4 | Jul 2026 | 4658.7 | ±13.8 |
| 5 | Aug 2026 | 4658.7 | ±13.8 |
| 6 | Sep 2026 | 4658.7 | ±13.8 |
| 7 | Oct 2026 | 4737.7 | ±15.4 |
| 8 | Nov 2026 | 4737.7 | ±15.4 |
Get the Rest of the Story with the 5 Year Forecast!
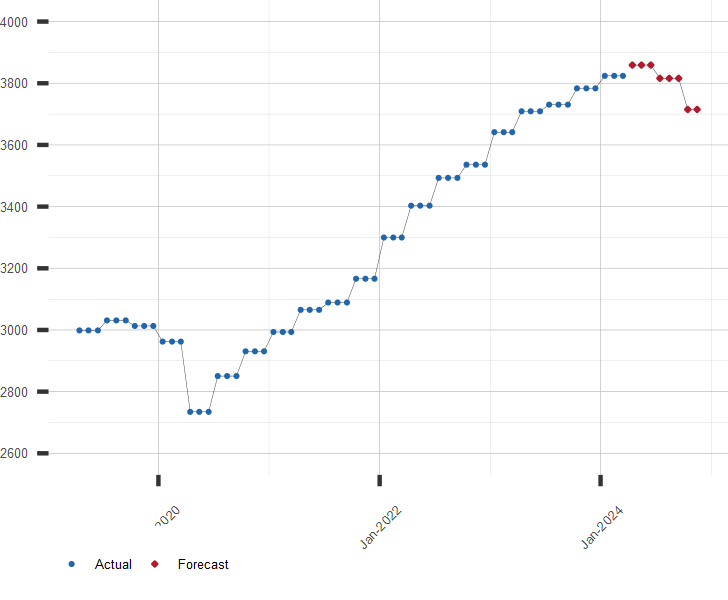
Chart of U.S. Nonresidential Fixed Investment with Forecast
Billion US Dollars. Annual Rate, Seasonally Adjusted.
Other Capital Investment Links of Interest:
A long range forecast for Private Nonresidential Fixed Investment and similar economic series is available by subscription. Click here to subscribe now!
| May 13, 2026 | |
| Indicator | Value |
|---|---|
| S&P 500 | 7444.25 |
| U.S. GDP Growth, YoY % | 2.66 |
| U.S. Inflation Rate, % | 3.81 |
| Gold Price, $/oz-t | 4691.60 |
| Crude Oil Futures, $/bbl | 101.23 |
| U.S. 10 Year Treasury, % | 4.46 |