U.S. Consumer Credit Forecast
U.S. Total Consumer Credit Forecast Values
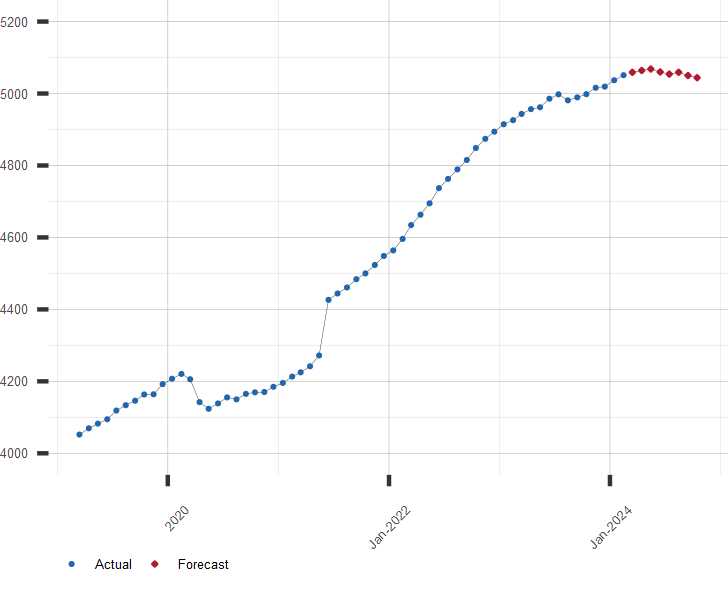
Total Consumer Credit Outstanding. Billion US Dollars, SA.
| Month | Date | Forecast Value | Avg Error |
|---|---|---|---|
| 0 | May 2026 | 5154.54 | ±0.00 |
| 1 | Jun 2026 | 5171.0 | ±6.2 |
| 2 | Jul 2026 | 5182.0 | ±7.5 |
| 3 | Aug 2026 | 5192.0 | ±8.3 |
| 4 | Sep 2026 | 5208.0 | ±8.8 |
| 5 | Oct 2026 | 5220.0 | ±9.3 |
| 6 | Nov 2026 | 5237.0 | ± 9.6 |
| 7 | Dec 2026 | 5256.0 | ± 9.9 |
| 8 | Jan 2027 | 5264.0 | ±10.2 |
Get the Rest of the Story with the 5 Year Forecast!
Chart of Consumer Credit with Forecast
Billion USD, includes forecast.
Other Credit and Loan Links of Interest:
A long range forecast for Consumer Credit and similar economic series is available by subscription. Click here for more information on our long range Consumer Credit Forecast or to subscribe now
| July 29, 2026 | |
| Indicator | Value |
|---|---|
| S&P 500 | 7316.15 |
| U.S. GDP Growth, YoY % | 2.68 |
| U.S. Inflation Rate, % | 3.53 |
| Gold Price, $/oz-t | 4066.34 |
| Crude Oil Futures, $/bbl | 84.60 |
| U.S. 10 Year Treasury, % | 4.67 |