U.S. Personal Income Forecast
U.S. Personal Income Forecast Values
Billion US Dollars. Annual Rate, Seasonally Adjusted.
| Month | Date | Forecast Value | Avg Error |
|---|---|---|---|
| 0 | Jan 2026 | 26698.90 | ±0.00 |
| 1 | Feb 2026 | 26795.0 | ±34.0 |
| 2 | Mar 2026 | 26924.0 | ±39.0 |
| 3 | Apr 2026 | 27062.0 | ±41.9 |
| 4 | May 2026 | 27157.0 | ±44.0 |
| 5 | Jun 2026 | 27219.0 | ±45.6 |
| 6 | Jul 2026 | 27293.0 | ±46.9 |
| 7 | Aug 2026 | 27375.0 | ±48.0 |
| 8 | Sep 2026 | 27460.0 | ±49.0 |
Get the Rest of the Story with the 5 Year Forecast!
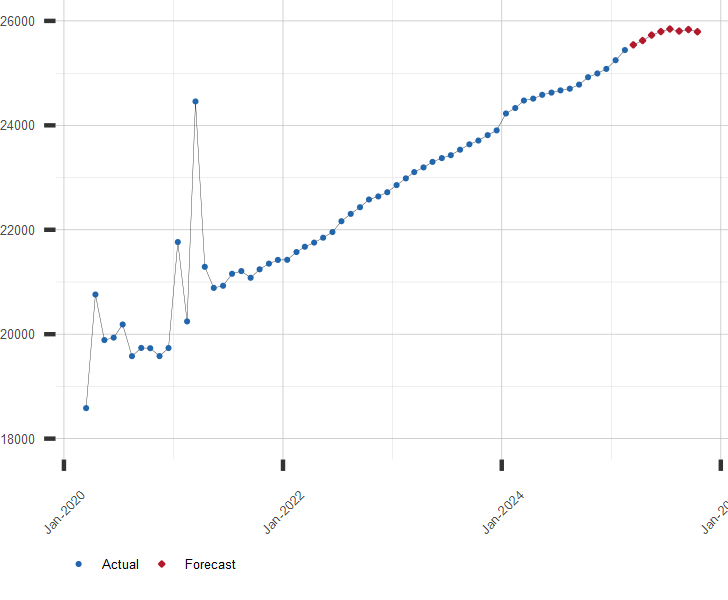
Chart of Personal Income with Current Forecast
Billion US Dollars. Annual Rate, Seasonally Adjusted.
Other Personal Income Links of Interest:
A long range forecast for Personal Income and similar economic series is available by subscription. Click here to subscribe now!
| March 23, 2026 | |
| Indicator | Value |
|---|---|
| S&P 500 | 6581.00 |
| U.S. GDP Growth, YoY % | 2.03 |
| U.S. Inflation Rate, % | 2.41 |
| Gold Price, $/oz-t | 4393.60 |
| Crude Oil Futures, $/bbl | 88.71 |
| U.S. 10 Year Treasury, % | 4.34 |