Total U.S. Loans & Leases Forecast
Total Loans and Leases Forecast
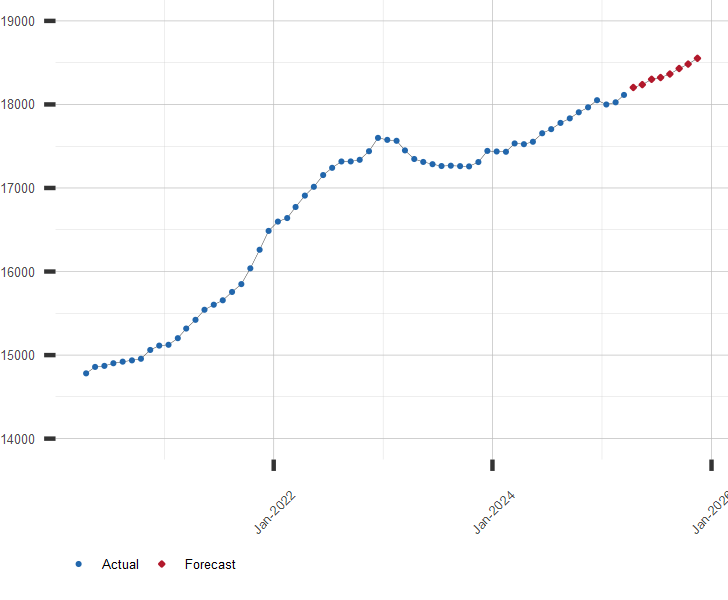
Total Loans and Leases All U.S. Commercial Banks. Billion USD. SA.
| Month | Date | Forecast Value | Avg Error |
|---|---|---|---|
| 0 | May 2026 | 19538.26 | ±0.00 |
| 1 | Jun 2026 | 19628.0 | ±37.0 |
| 2 | Jul 2026 | 19741.0 | ±42.1 |
| 3 | Aug 2026 | 19830.0 | ±45.1 |
| 4 | Sep 2026 | 19935.0 | ±47.3 |
| 5 | Oct 2026 | 19987.0 | ±48.9 |
| 6 | Nov 2026 | 20115.0 | ±50.3 |
| 7 | Dec 2026 | 20263.0 | ±51.4 |
| 8 | Jan 2027 | 20380.0 | ±52.4 |
Get the Rest of the Story with the 5 Year Forecast!
Chart of U.S. Total Loan and Lease Bank Credit with Forecast
Billion USD. Seasonally Adjusted.
Other Banking and Credit Resources:
A long range forecast for Bank Credit, Consumer Credit and similar economic series is available by subscription. Click here for more information or to subscribe.
| July 13, 2026 | |
| Indicator | Value |
|---|---|
| S&P 500 | 7515.34 |
| U.S. GDP Growth, YoY % | 2.68 |
| U.S. Inflation Rate, % | 4.25 |
| Gold Price, $/oz-t | 4001.19 |
| Crude Oil Futures, $/bbl | 78.00 |
| U.S. 10 Year Treasury, % | 4.62 |