The Financial Forecast Center™
Independent. Objective. Accurate.
Home
About Us
Contact Us
Subscribe
Subscriber Log In
Stock Market Forecasts
Interest Rate Forecasts
Exchange Rate Forecasts
Economics & Price Forecasts
Historical Data
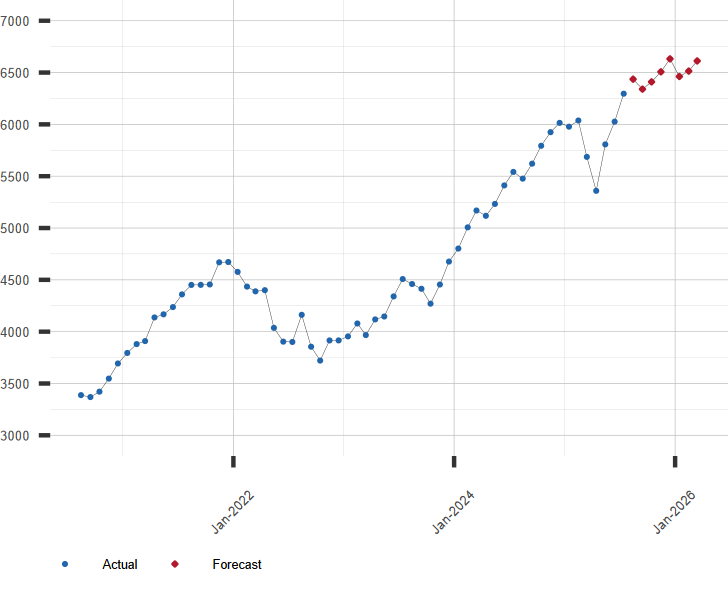
S&P 500 Forecast
S&P 500 Stock Index Forecast Values
Stock Price Index Values, Average of Month.
| Month |
Date |
Forecast Value |
Avg Error |
| 0 |
May 2026 |
7405.86 |
±0.00 |
| 1 |
Jun 2026 |
7631.0 |
±52.0 |
| 2 |
Jul 2026 |
7731.0 |
±59.6 |
| 3 |
Aug 2026 |
7817.0 |
±64.1 |
| 4 |
Sep 2026 |
7892.0 |
±67.2 |
| 5 |
Oct 2026 |
8003.0 |
±69.7 |
| 6 |
Nov 2026 |
8124.0 |
±71.7 |
| 7 |
Dec 2026 |
8305.0 |
±73.4 |
| 8 |
Jan 2027 |
8422.0 |
±74.9 |
Download Historical Data
Get the Rest of the Story with the 5 Year Forecast!
S&P 500 Stock Index Chart
Chart of S&P 500 with Current Projection
Other Stock Market Resources:
A long range forecast for this or similar financial series is available by subscription
Click here for more information or to subscribe now
Current Stock Markets
| June 08, 2026 |
| Stock Market |
Value |
Change |
| U.S. S&P 500 |
7,405.73 |
0.30% |
| Japan Nikkei 225 |
64,024.60 |
-3.85% |
| Hong Kong Hang Seng |
24,657.06 |
-1.22% |
| UK FTSE 100 |
10,373.20 |
0.05% |
| German DAX |
24,616.22 |
-0.58% |
| Brazil Bovespa |
168,668.72 |
-0.21% |
Popular Forecasts
Exchange Rate Forecasts
Interest Rate Forecasts
Stock Market Forecasts
Price and Economy Forecasts