Wilshire 5000 Stock Index Forecast
Wilshire 5000 Forecast Values
Stock Price Index Values, Average of Month.
| Month | Date | Forecast Value | Avg Error |
|---|---|---|---|
| 0 | Jun 2025 | 59257.84 | ±0.00 |
| 1 | Jul 2025 | 60837.0 | ±494.0 |
| 2 | Aug 2025 | 59508.0 | ±643.7 |
| 3 | Sep 2025 | 58809.0 | ±731.3 |
| 4 | Oct 2025 | 59430.0 | ±793.4 |
| 5 | Nov 2025 | 59690.0 | ±841.6 |
| 6 | Dec 2025 | 60800.0 | ±881.0 |
| 7 | Jan 2026 | 61440.0 | ±914.3 |
| 8 | Feb 2026 | 60160.0 | ±943.2 |
Get the Rest of the Story with the 5 Year Forecast!
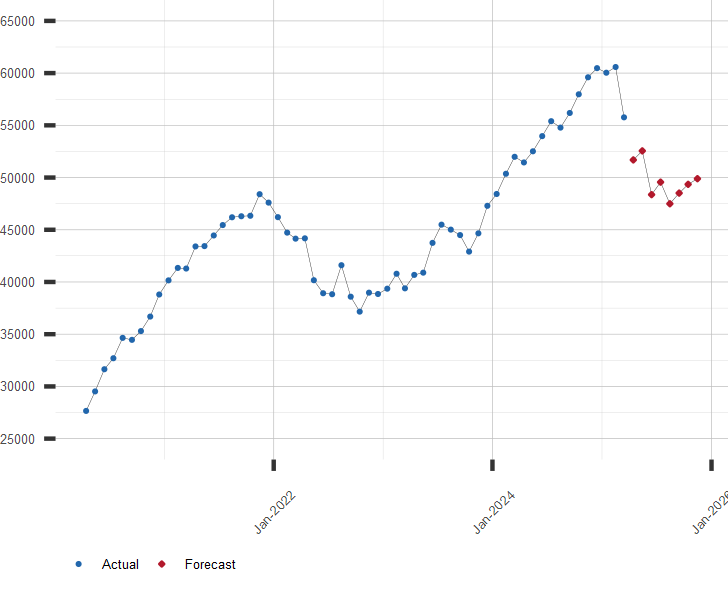
Chart of Wilshire 5000 with Forecast
Stock Price Index Values, Average of Month.
Other Wilshire 5000 and Stock Market Resources:
A long range forecast for the Wilshire 5000 and similar financial series is available by subscription. Click here to subscribe now!
| July 02, 2025 | ||
| Stock Market | Value | Change |
|---|---|---|
| U.S. S&P 500 | 6,227.42 | 0.47% |
| Japan Nikkei 225 | 39,762.48 | -0.56% |
| Hong Kong Hang Seng | 24,221.41 | 0.62% |
| UK FTSE 100 | 8,774.69 | -0.12% |
| German DAX | 23,790.11 | 0.49% |
| Brazil Bovespa | 139,050.90 | -0.36% |