U.S. Corporate Profits Forecast
U.S. Corporate Profits Forecast Values
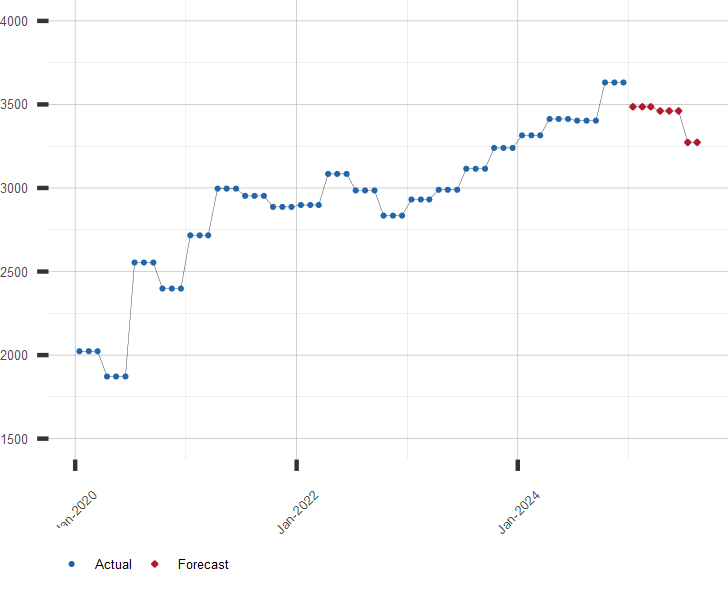
Corporate Profits After Tax. Billion US Dollars. SAAR.
| Month | Date | Forecast Value | Avg Error |
|---|---|---|---|
| 0 | Sep 2025 | 3591.3 | ±0.0 |
| 1 | Oct 2025 | 3649.0 | ±38.0 |
| 2 | Nov 2025 | 3649.0 | ±38.0 |
| 3 | Dec 2025 | 3649.0 | ±38.0 |
| 4 | Jan 2026 | 3727.0 | ±45.1 |
| 5 | Feb 2026 | 3727.0 | ±45.1 |
| 6 | Mar 2026 | 3727.0 | ±45.1 |
| 7 | Apr 2026 | 3745.0 | ±47.9 |
| 8 | May 2026 | 3745.0 | ±47.9 |
Get the Rest of the Story with the 5 Year Forecast!
Chart of U.S. Corporate Profits
Billion USD. Includes Current Prediction.
Other Industry and Corporate Resources:
A long range forecast for U.S. Corporate Profits and similar economic series is available by subscription. Click here to subscribe to Corporate Profits extended forecast.
| May 14, 2026 | |
| Indicator | Value |
|---|---|
| S&P 500 | 7501.24 |
| U.S. GDP Growth, YoY % | 2.66 |
| U.S. Inflation Rate, % | 3.81 |
| Gold Price, $/oz-t | 4649.60 |
| Crude Oil Futures, $/bbl | 101.88 |
| U.S. 10 Year Treasury, % | 4.47 |