Inventory to Sales Ratio Forecast
You might ask yourself "so what?" Why does the inventory to sales ratio matter? Well, it turns out the inventory to sales ratio is a good proxy for real economic recessions. When the IS ratio goes above trend, as it did in 2001, 2009 and 2015, the U.S. economy is in a recession.
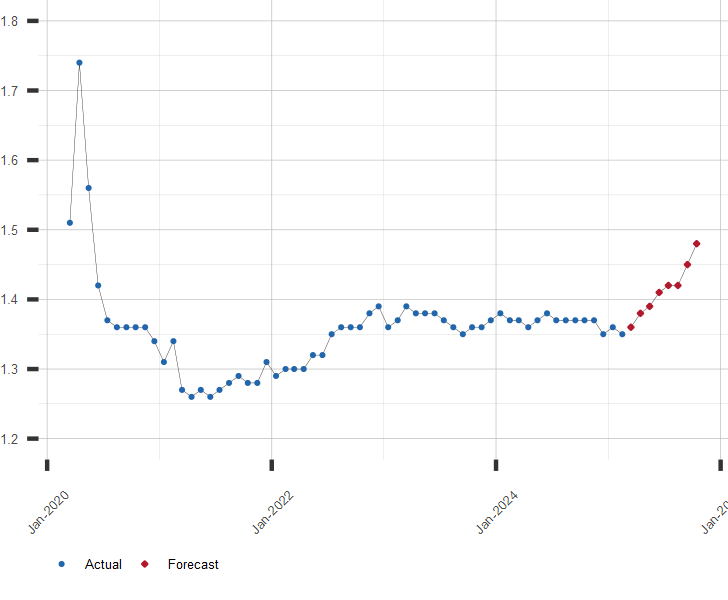
U.S. Inventory to Sales Ratio Forecast
Ratio Total Business Inventory to Total Business Sales. Seasonally Adjusted.
| Month | Date | Forecast Value | Avg Error |
|---|---|---|---|
| 0 | Apr 2026 | 1.31 | ±0.00 |
| 1 | May 2026 | 1.31 | ±0.0083 |
| 2 | Jun 2026 | 1.32 | ±0.01 |
| 3 | Jul 2026 | 1.34 | ±0.012 |
| 4 | Aug 2026 | 1.35 | ±0.012 |
| 5 | Sep 2026 | 1.33 | ±0.013 |
| 6 | Oct 2026 | 1.32 | ±0.014 |
| 7 | Nov 2026 | 1.31 | ±0.014 |
| 8 | Dec 2026 | 1.33 | ±0.015 |
Get the Rest of the Story with the 5 Year Forecast!
Chart of U.S. Inventory to Sales Ratio with Current Outlook.
Other Business Links of Interest:
A long range forecast for IS Ratio and similar economic series is available by subscription. Click here to subscribe to the Extended Forecasts
| July 16, 2026 | |
| Indicator | Value |
|---|---|
| S&P 500 | 7533.77 |
| U.S. GDP Growth, YoY % | 2.68 |
| U.S. Inflation Rate, % | 3.53 |
| Gold Price, $/oz-t | 3975.20 |
| Crude Oil Futures, $/bbl | 78.95 |
| U.S. 10 Year Treasury, % | 4.57 |