U.S. GDP Price Deflator Forecast
U.S. GDP Price Deflator Forecast Values
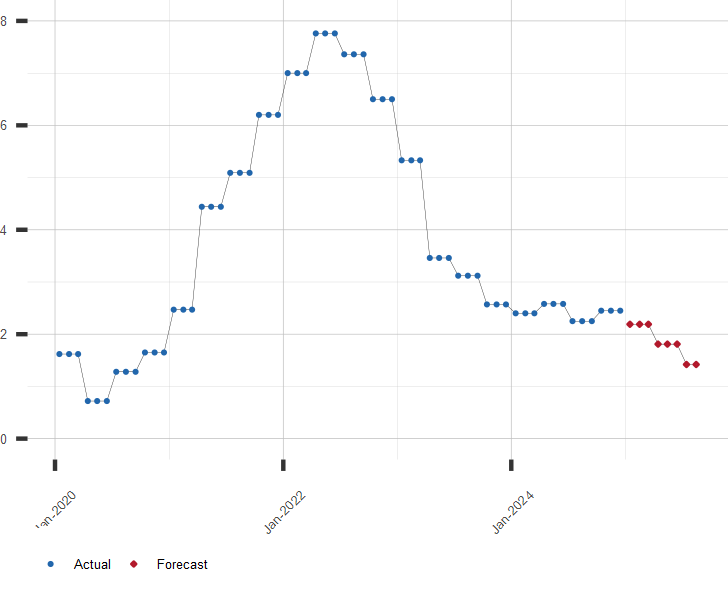
Year over Year Percent Change in US GDP Price Deflator.
| Month | Date | Forecast Value | Avg Error |
|---|---|---|---|
| 0 | Mar 2026 | 3.29 | ±0.00 |
| 1 | Apr 2026 | 3.65 | ±0.10 |
| 2 | May 2026 | 3.65 | ±0.10 |
| 3 | Jun 2026 | 3.65 | ±0.10 |
| 4 | Jul 2026 | 3.33 | ±0.16 |
| 5 | Aug 2026 | 3.33 | ±0.16 |
| 6 | Sep 2026 | 3.33 | ±0.16 |
| 7 | Oct 2026 | 2.93 | ±0.18 |
| 8 | Nov 2026 | 2.93 | ±0.18 |
Get the Rest of the Story with the 5 Year Forecast!
Chart of U.S. GDP Price Deflator With Forecast
Percent Change in GDP Price Deflator
Other GDP and Inflation Links of Interest:
A long range forecast for this and similar economic series is available by subscription. Click here for more information or to subscribe now!
| May 12, 2026 | |
| Indicator | Value |
|---|---|
| S&P 500 | 7400.96 |
| U.S. GDP Growth, YoY % | 2.66 |
| U.S. Inflation Rate, % | 3.81 |
| Gold Price, $/oz-t | 4714.40 |
| Crude Oil Futures, $/bbl | 102.11 |
| U.S. 10 Year Treasury, % | 4.46 |