WTI Crude Oil Price Outlook
Crude Oil Price Forecast Values
West Texas Intermediate, USD/bbl. Average of Month.
| Month | Date | Forecast Value | Avg Error |
|---|---|---|---|
| 0 | Mar 2024 | 81.28 | ±0.00 |
| 1 | Apr 2024 | 85.6 | ±2.7 |
| 2 | May 2024 | 84.1 | ±3.6 |
| 3 | Jun 2024 | 85.3 | ±4.1 |
| 4 | Jul 2024 | 88.6 | ±4.5 |
| 5 | Aug 2024 | 94.1 | ±4.8 |
| 6 | Sep 2024 | 91.0 | ±5.0 |
| 7 | Oct 2024 | 88.4 | ±5.2 |
| 8 | Nov 2024 | 88.9 | ±5.4 |
Get the Rest of the Story with the 5 Year Forecast!
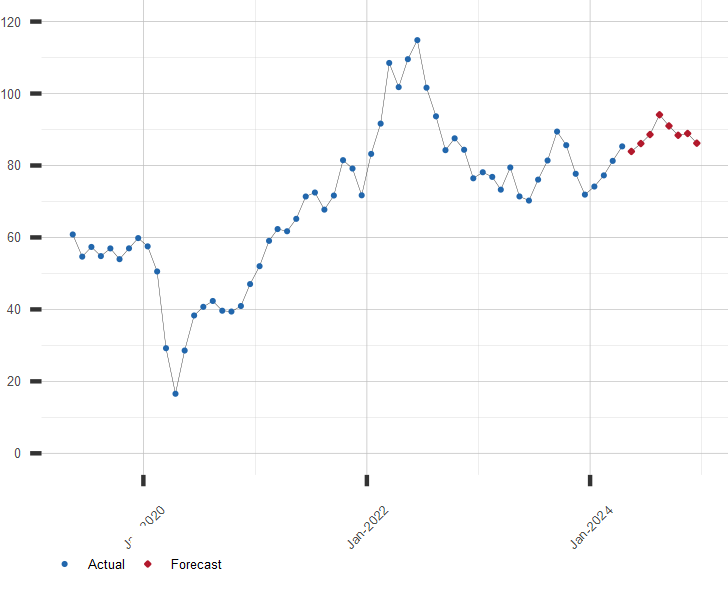
Crude Oil Prices
Chart of WTI Crude Oil Price with Current Projection
West Texas Intermediate. US Dollars per barrel.
Other Oil Price Links of Interest:
A long range forecast for this or similar economic series is available by subscription
Click here for more information or to subscribe now| April 25, 2024 | |
| Indicator | Value |
|---|---|
| S&P 500 | 5048.42 |
| U.S. GDP Growth, YoY % | 2.97 |
| U.S. Inflation Rate, % | 3.48 |
| Gold Price, $/oz-t | 2331.70 |
| Crude Oil Futures, $/bbl | 83.78 |
| U.S. 10 Year Treasury, % | 4.70 |