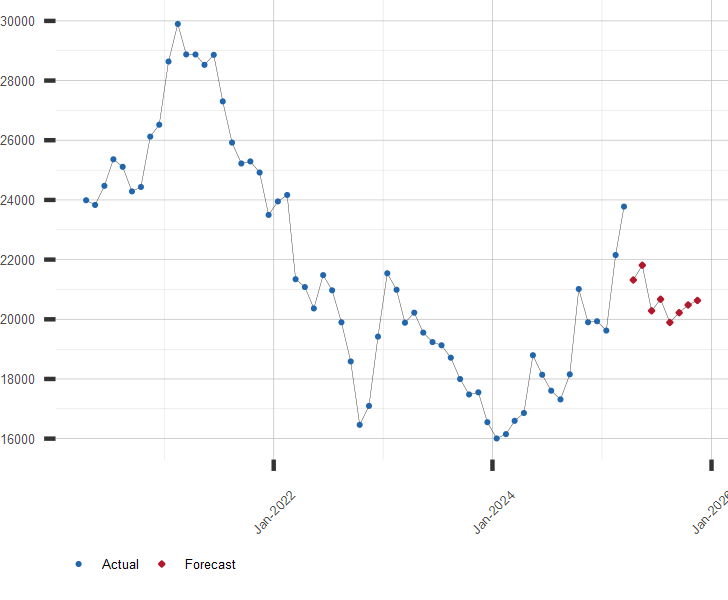
Forecast of Hang Seng Stock Index HSI
Hang Seng Stock Index Forecast Values
Index Values, Average of Month.
| Month | Date | Forecast Value | Avg Error |
|---|---|---|---|
| 0 | May 2026 | 25926.66 | ±0.00 |
| 1 | Jun 2026 | 26377.0 | ±838.0 |
| 2 | Jul 2026 | 26656.0 | ±925.3 |
| 3 | Aug 2026 | 26885.0 | ±976.4 |
| 4 | Sep 2026 | 27076.0 | ±1012.7 |
| 5 | Oct 2026 | 27389.0 | ±1040.8 |
| 6 | Nov 2026 | 27733.0 | ±1063.8 |
| 7 | Dec 2026 | 28270.0 | ±1083.2 |
| 8 | Jan 2027 | 28600.0 | ±1100.0 |
Get the Rest of the Story with the 5 Year Forecast!
Chart of Hang Seng Stock Index HSI with Forecast
Stock Price Index Values, Average of Month.
Other Stock Market Links of Interest:
A long range forecast for the Hang Seng and similar financial series is available by subscription. Click here for more information or to subscribe now
| June 08, 2026 | ||
| Stock Market | Value | Change |
|---|---|---|
| U.S. S&P 500 | 7,405.73 | 0.30% |
| Japan Nikkei 225 | 64,024.60 | -3.85% |
| Hong Kong Hang Seng | 24,657.06 | -1.22% |
| UK FTSE 100 | 10,373.20 | 0.05% |
| German DAX | 24,616.22 | -0.58% |
| Brazil Bovespa | 168,668.72 | -0.21% |